> ## Documentation Index
> Fetch the complete documentation index at: https://docs.gameball.co/llms.txt
> Use this file to discover all available pages before exploring further.
# What Is Gameball Analytics?
> Discover the analytics section, and learn how to use and navigate it to get the needed information.
Keeping track of your business performance helps you make better decisions and achieve your business goals. Tools that give you deep insights into the overall performance through business analytics. Knowing how applying loyalty strategies directly impacts your business performance makes monitoring the performance of the loyalty system equally as important as tracking the business growth itself; this is why Gameball has created an **analytics section**.
Gameball analytics helps you keep track of all loyalty and business-related data. Here are brief examples of some of the information you will find in the analytics sections:
* Track your total sales from Gameball programs.
* Learn how much your customers spend on your store and further details on your customers' placed orders.
* Gain insights into your customers' behavior to better tailor your loyalty and retargeting strategy on Gameball.
* Impact of Gameball on your revenue, business performance, and growth.
***
## Where to Find Gameball's Analytics Section
Go to Gameball **Dashboard**. From the left bar, click **Analytics**.
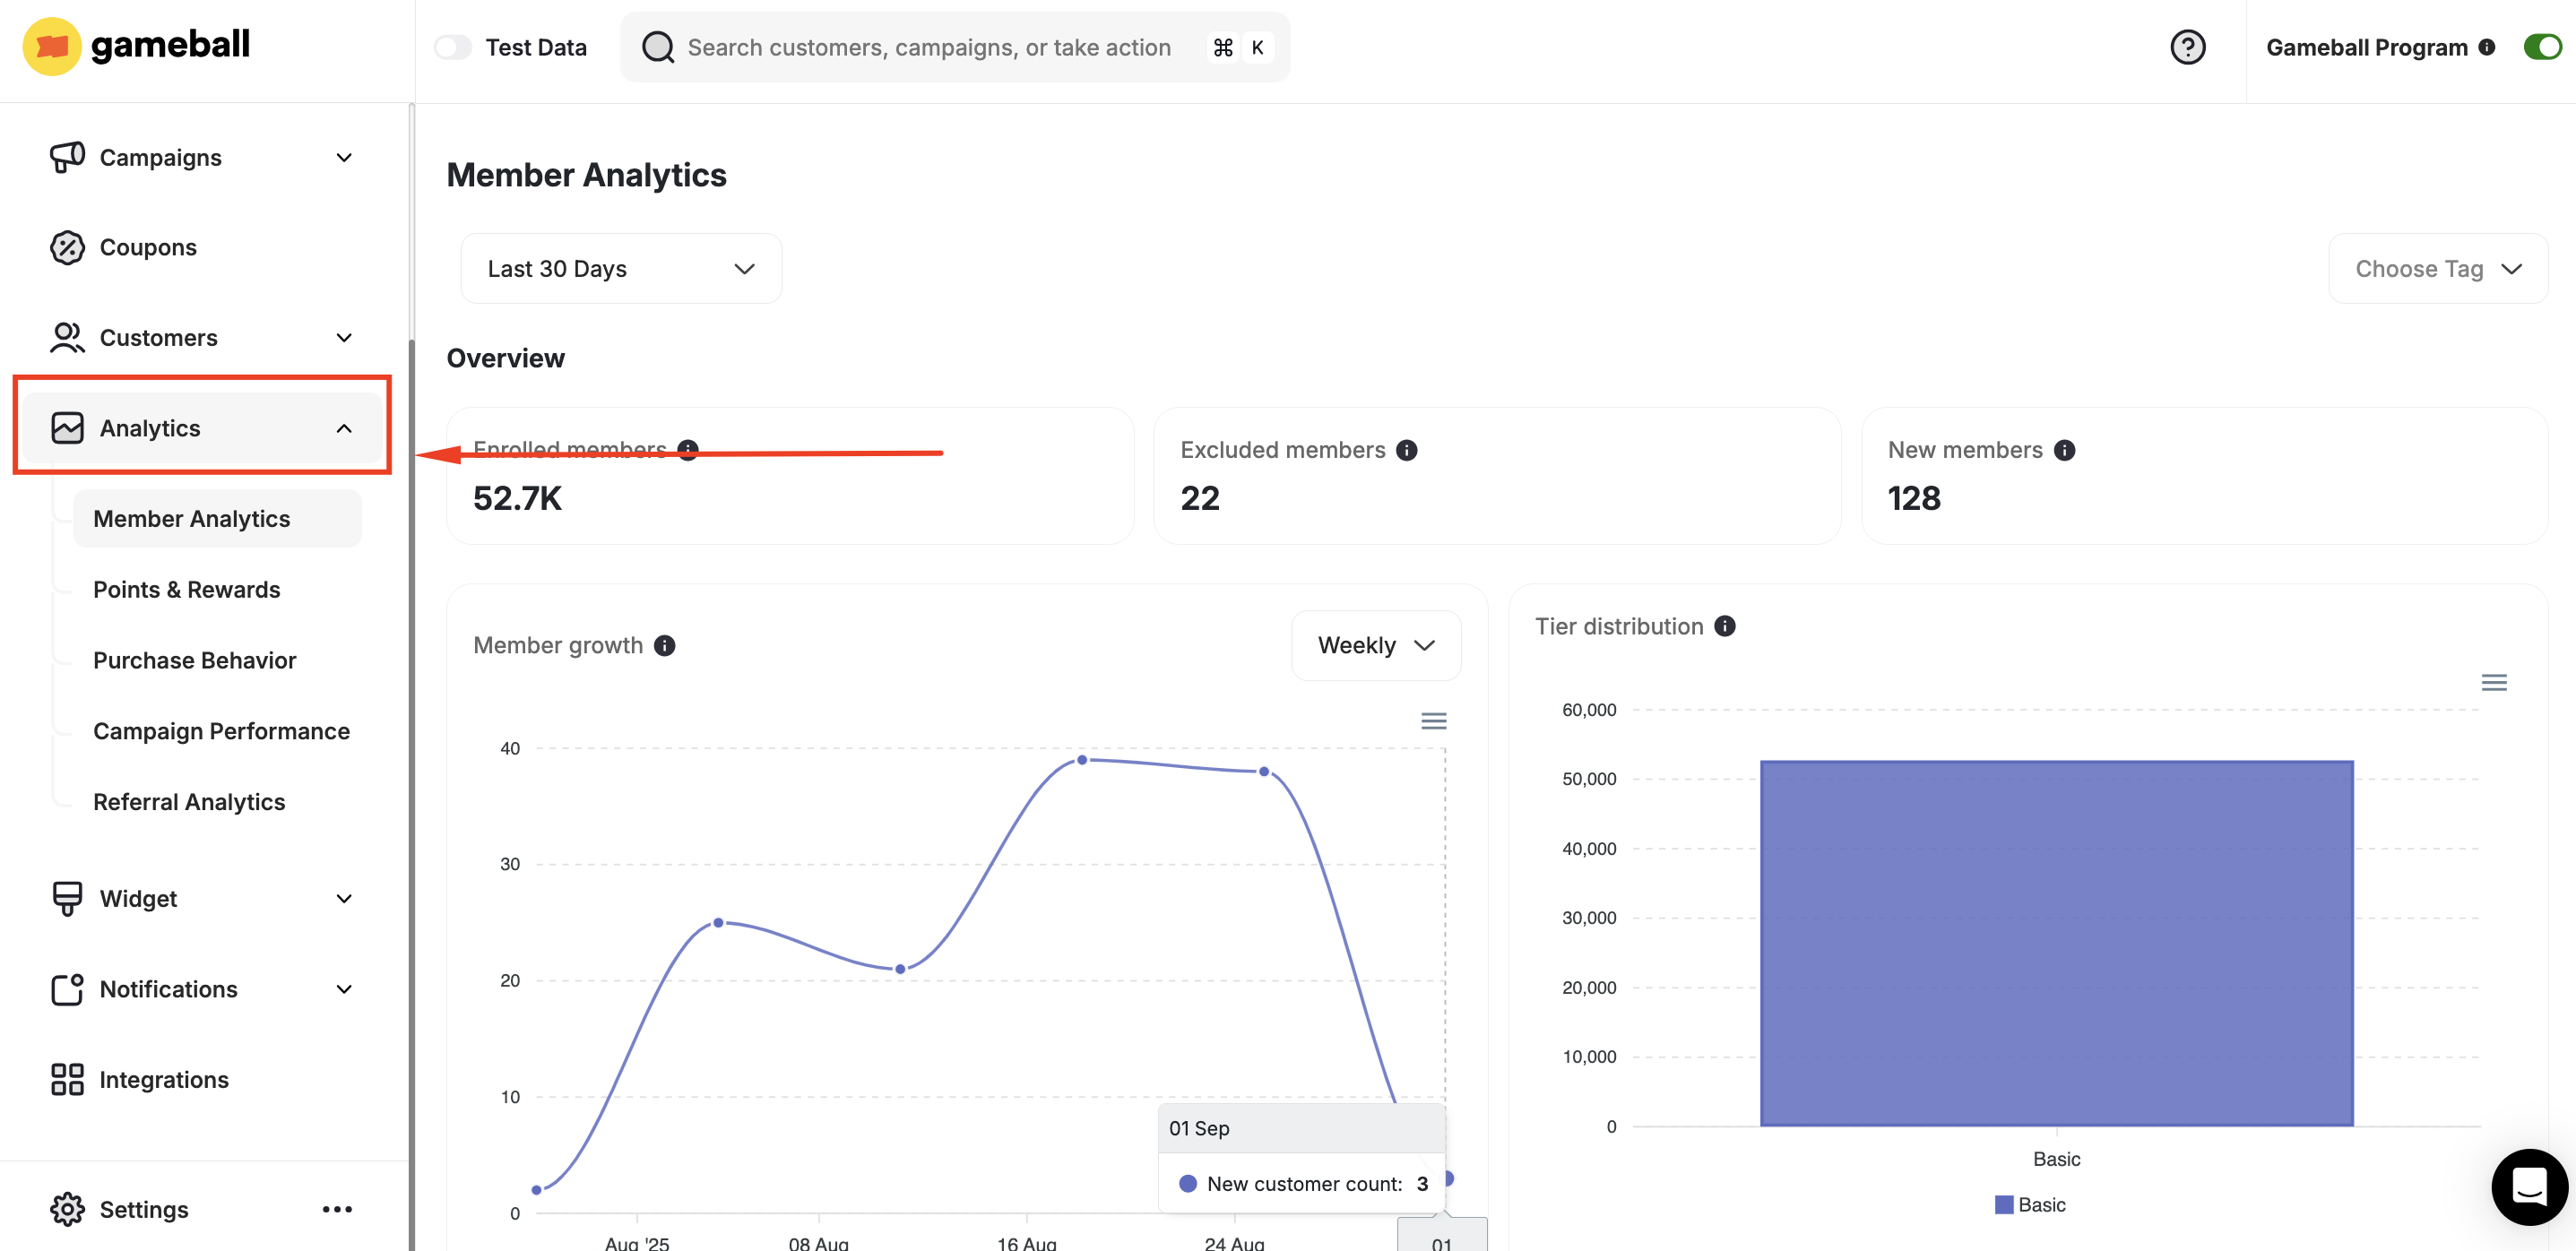 You will be on the **Members Analytics** page by default.
**There are four analytics sections you can explore:**
Track enrolled member growth, engagement rates, and retention metrics.
Monitor points earned, redeemed, burned, and export raw data as CSV.
Analyze customer spending, order values, and Gameball-attributed revenue.
Measure campaign reach, completion rates, and rewards distribution.
Evaluate referral activity, success rates, and revenue from referrals.
***
## What Do I Need to Know Before Diving Into the Analytics?
When looking straight at numbers and graphs for the first time, it might seem complicated or hard to grasp.
Here are some quick tips that will help you figure out what each number or graph means and how to navigate and assemble them according to your preferences:
When you are on any of the analytics pages, you can display the data from a particular time span or display all the data from the time you activated your program.
Click on the button at the top right of any page to select your preferred time span.
You will be on the **Members Analytics** page by default.
**There are four analytics sections you can explore:**
Track enrolled member growth, engagement rates, and retention metrics.
Monitor points earned, redeemed, burned, and export raw data as CSV.
Analyze customer spending, order values, and Gameball-attributed revenue.
Measure campaign reach, completion rates, and rewards distribution.
Evaluate referral activity, success rates, and revenue from referrals.
***
## What Do I Need to Know Before Diving Into the Analytics?
When looking straight at numbers and graphs for the first time, it might seem complicated or hard to grasp.
Here are some quick tips that will help you figure out what each number or graph means and how to navigate and assemble them according to your preferences:
When you are on any of the analytics pages, you can display the data from a particular time span or display all the data from the time you activated your program.
Click on the button at the top right of any page to select your preferred time span.
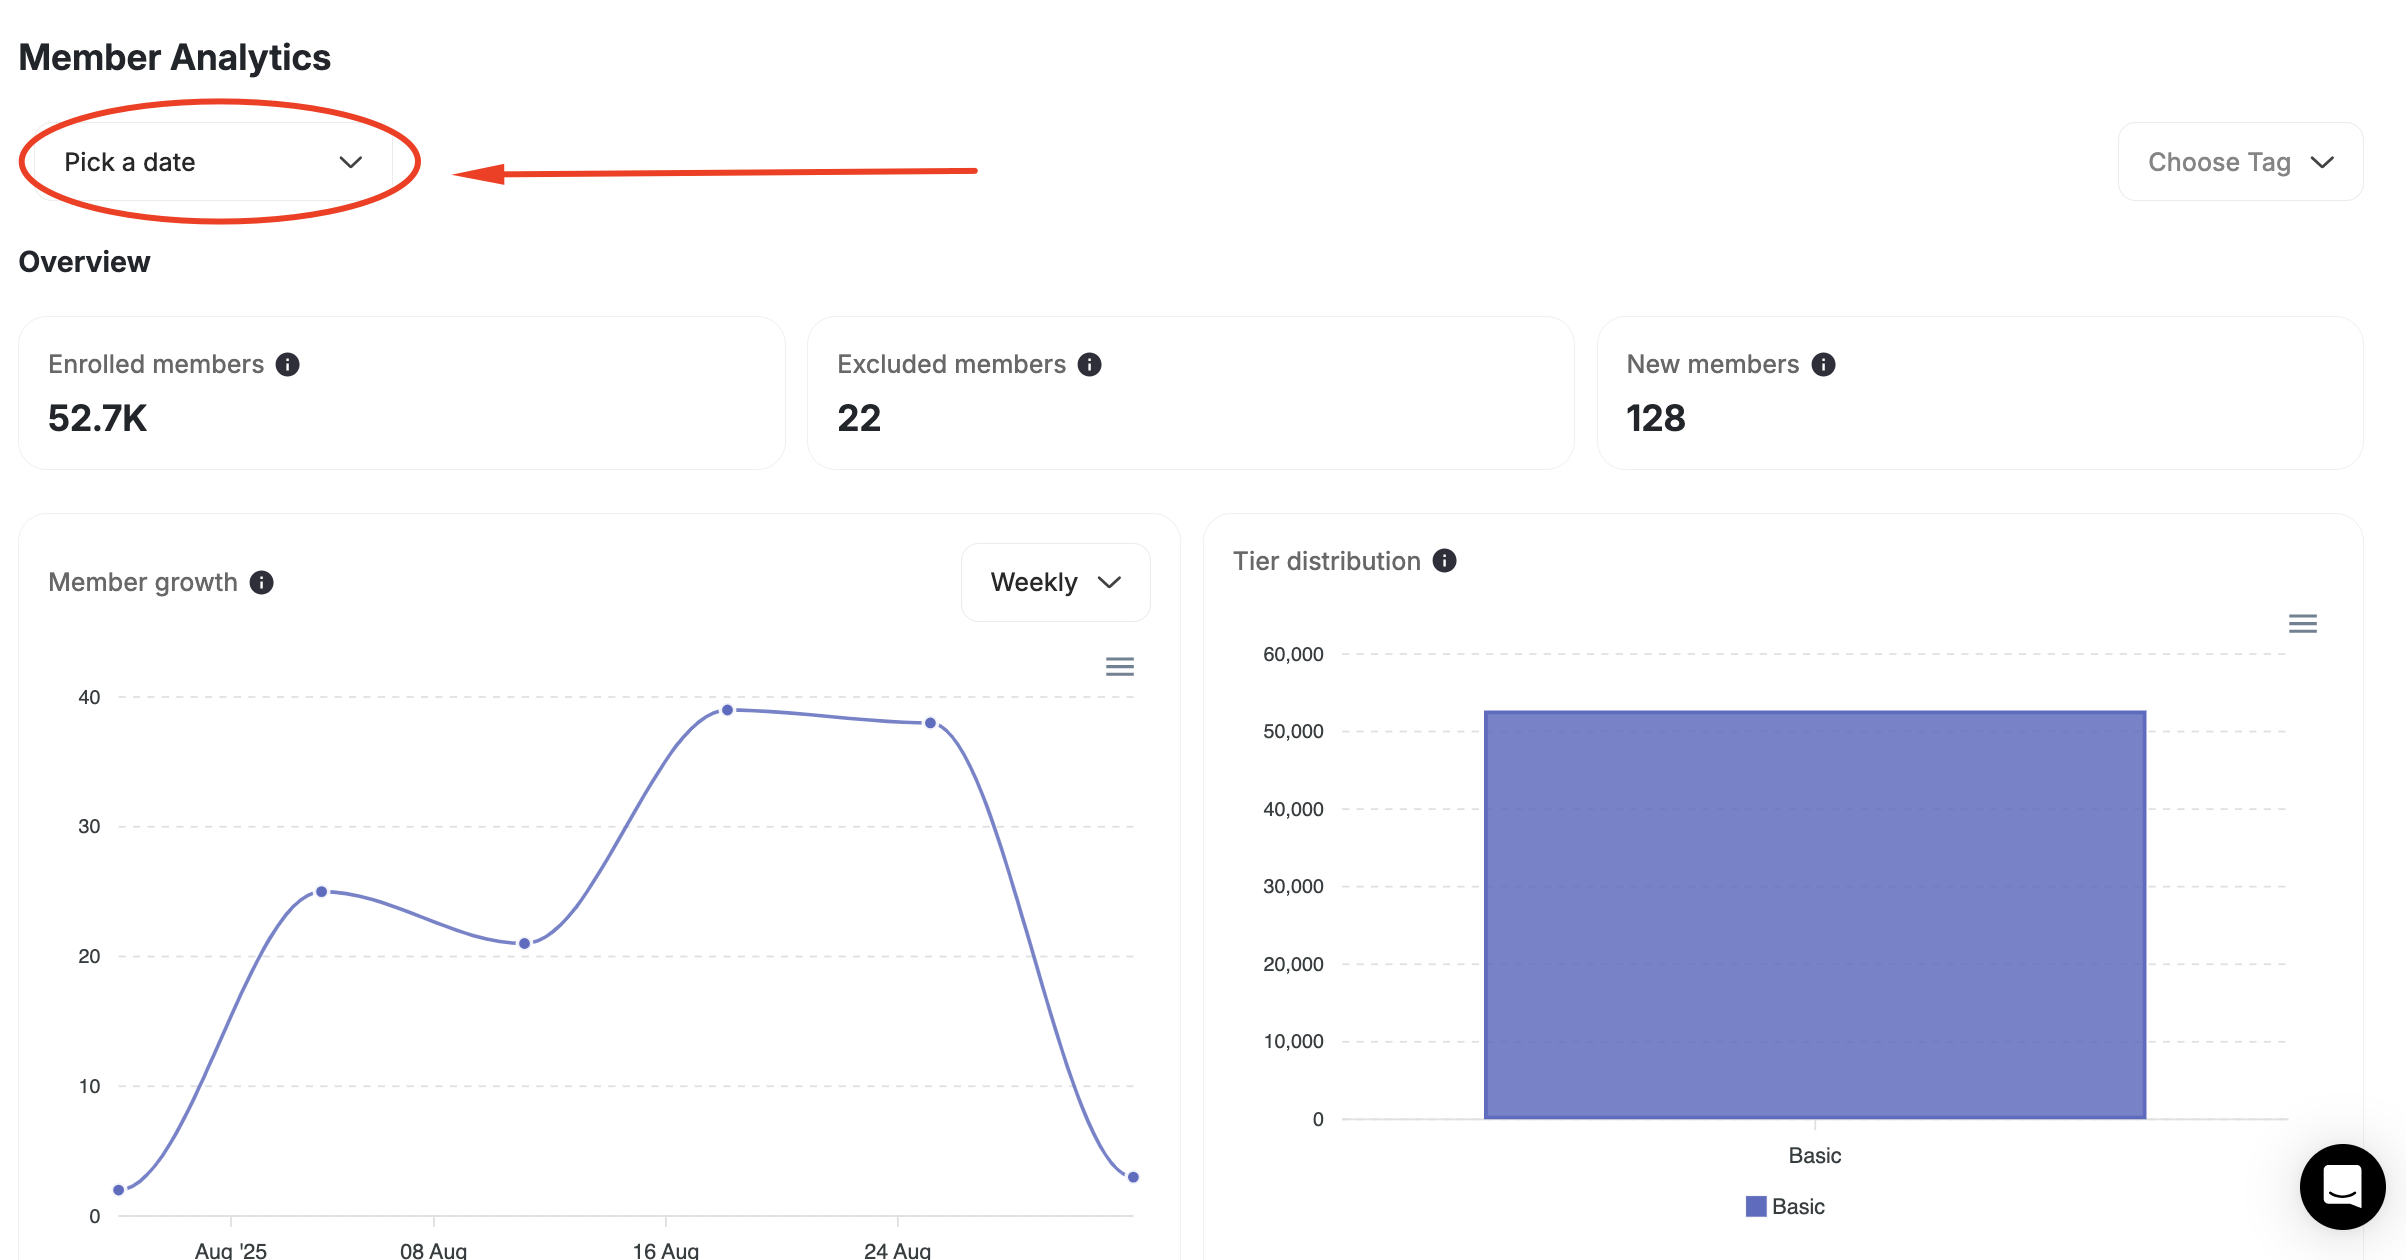 You can manually select a time span to display data between two random dates by clicking **"pick a date.."**
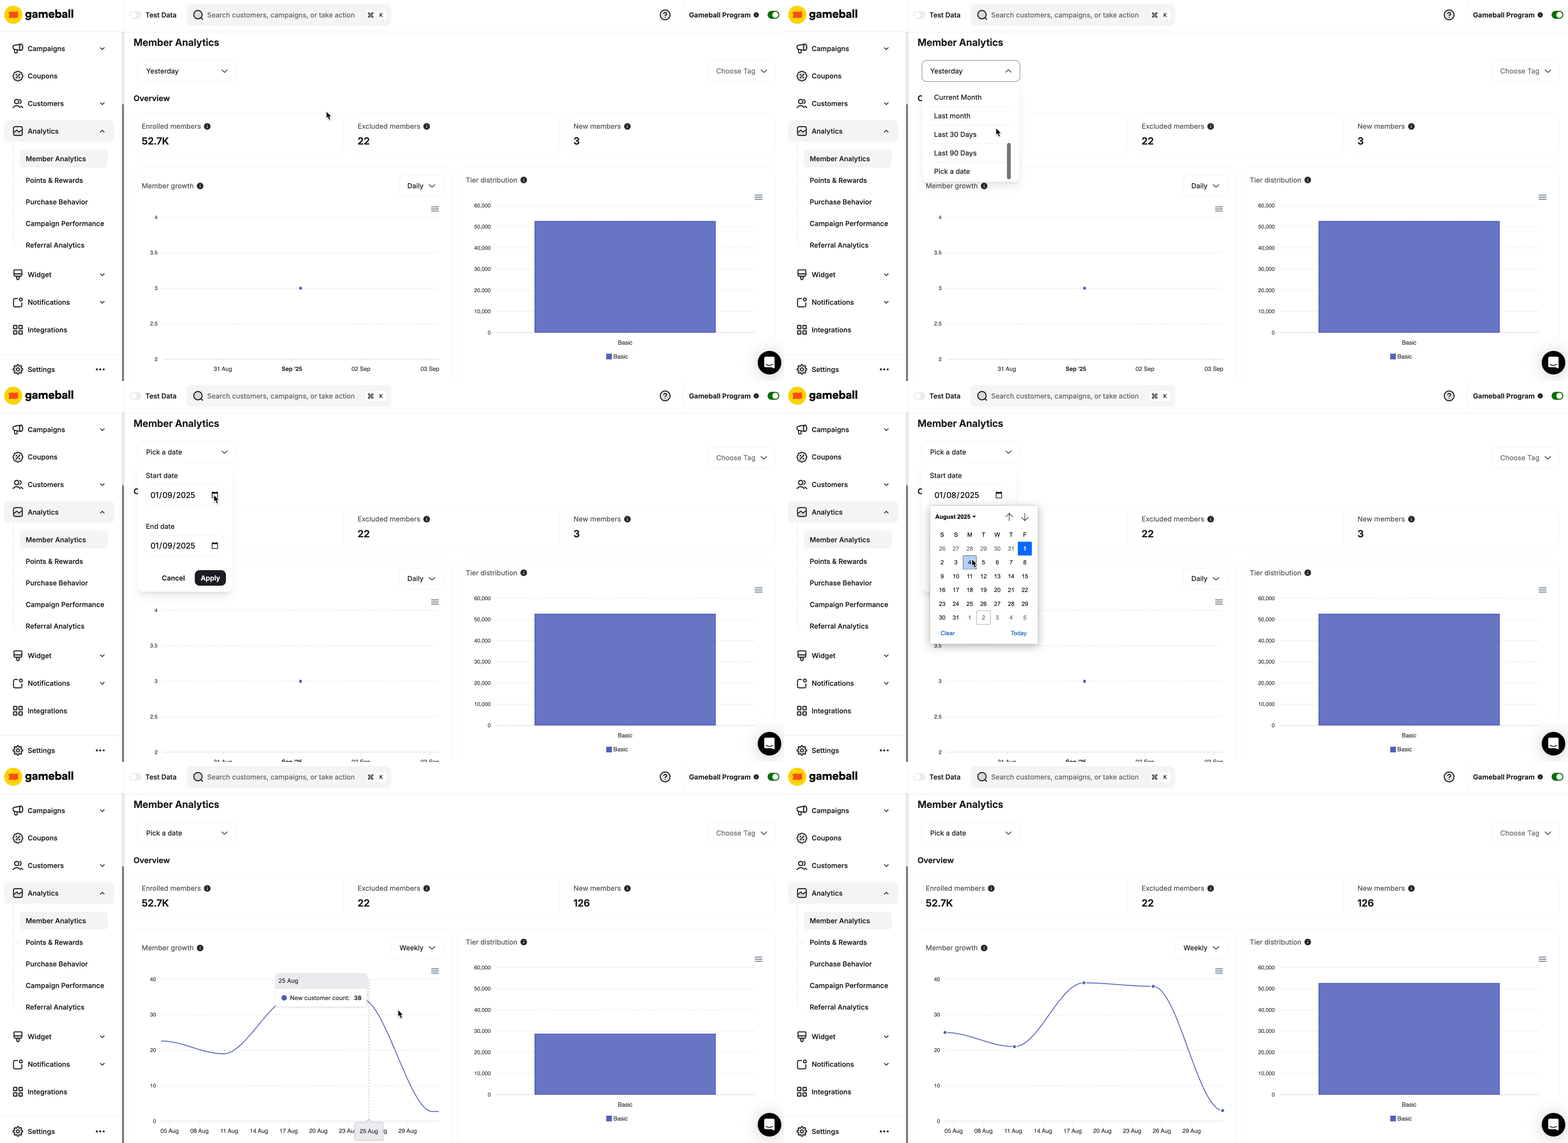 When you apply a time span filter, data that is impacted by this will show the progression or difference of numbers according to the selected period.
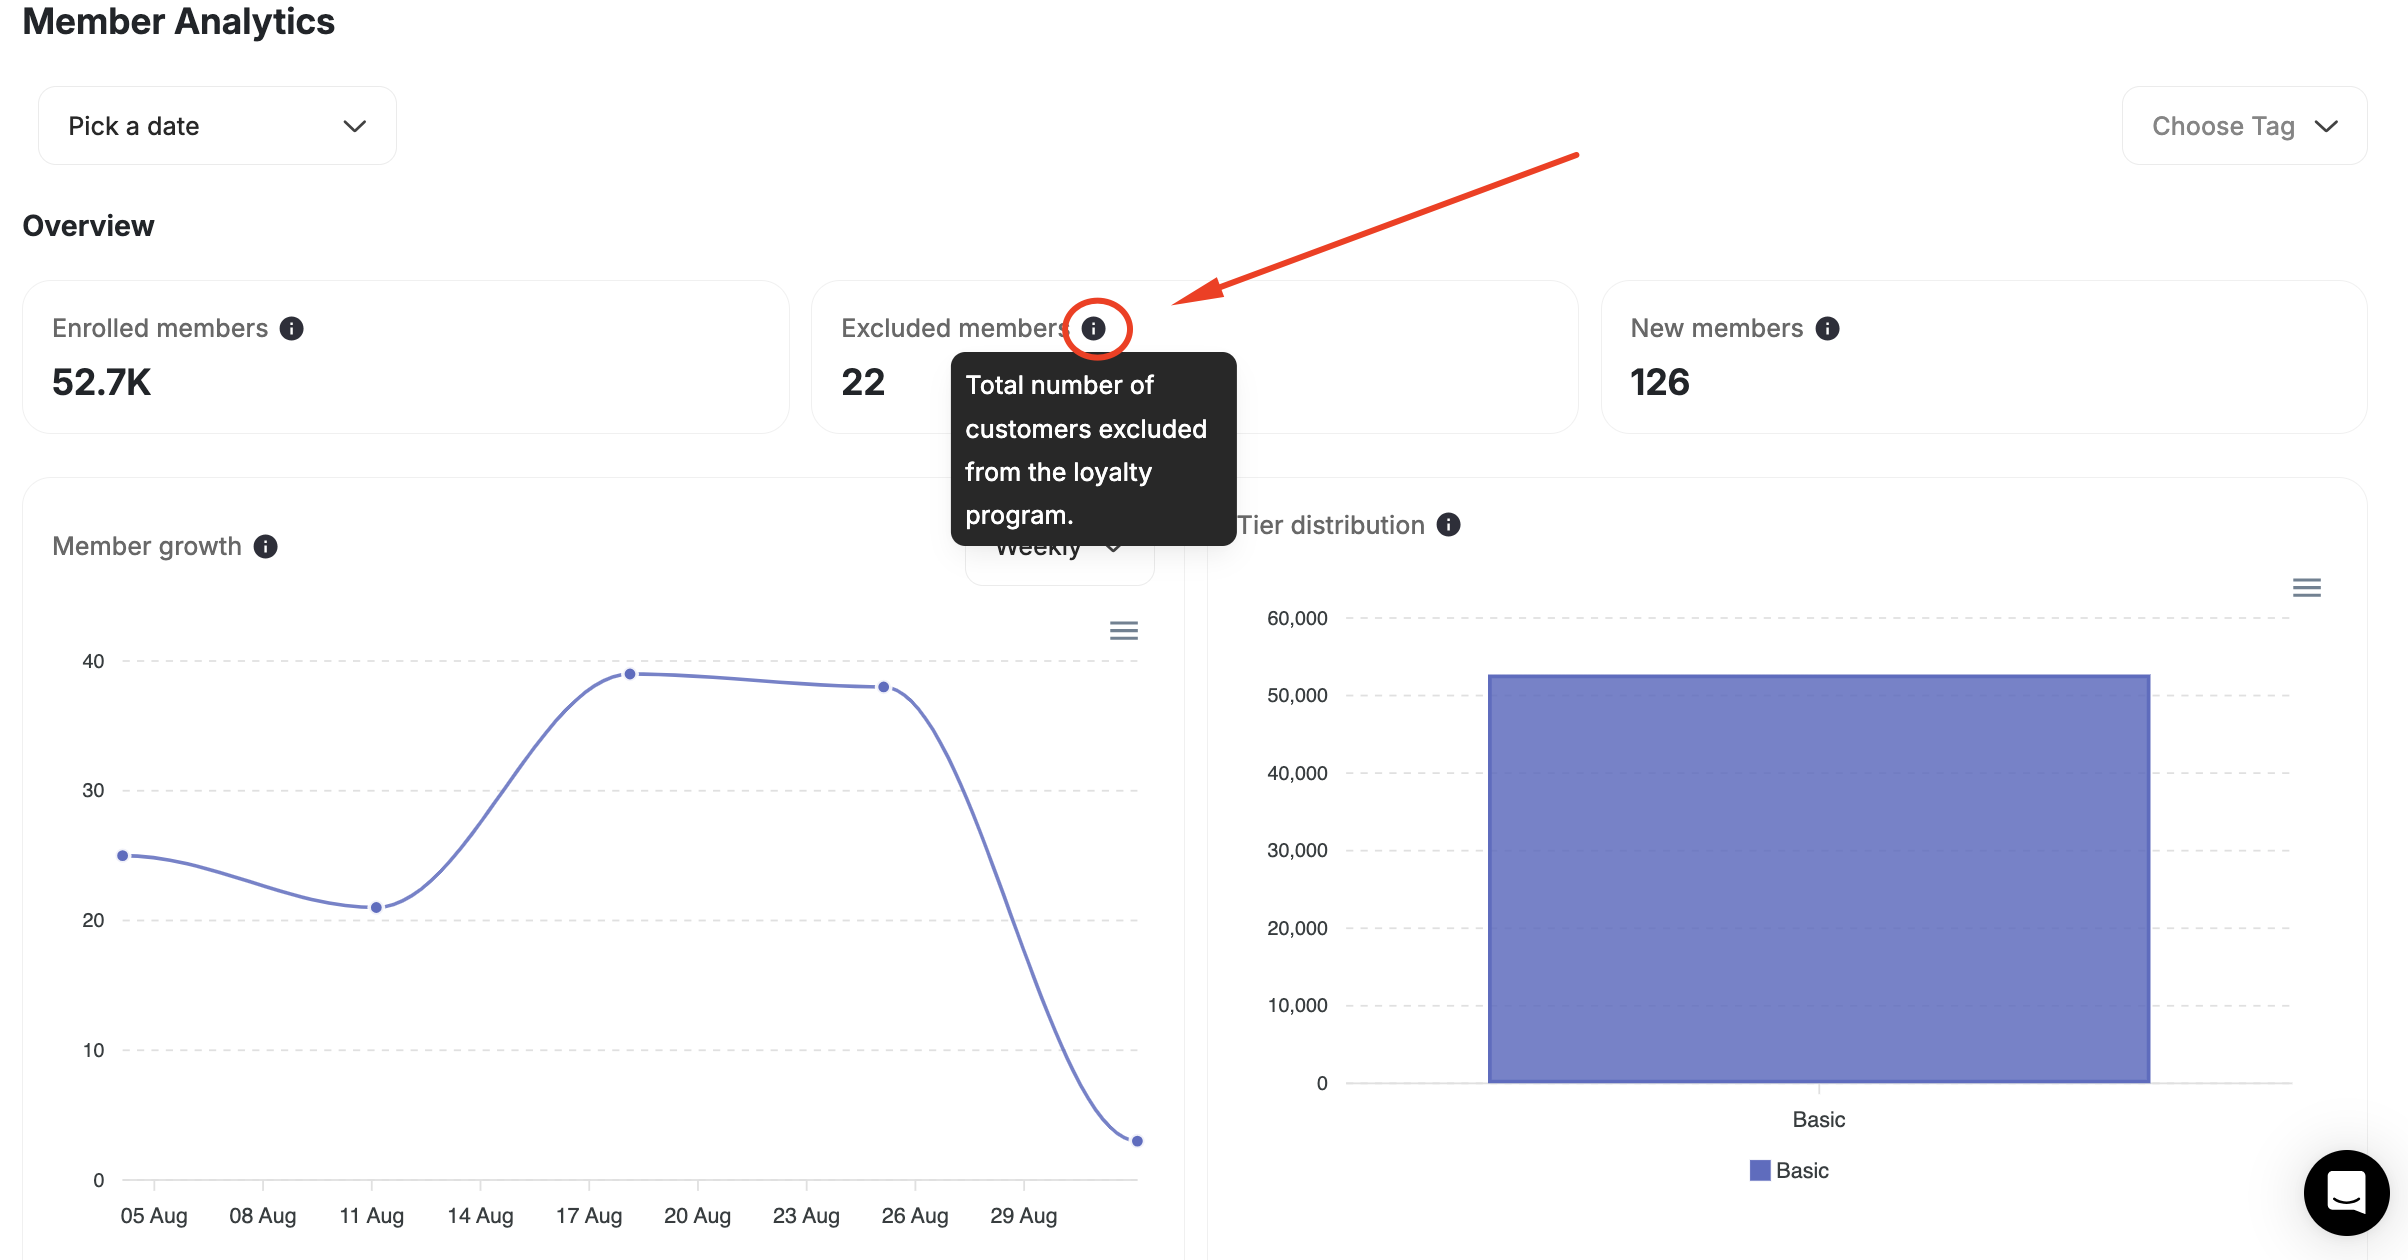
If you find yourself uncertain about what specific data refers to precisely, use your cursor to point at the **Information Icon** beside the data title to read a brief explanation about it.
When you apply a time span filter, data that is impacted by this will show the progression or difference of numbers according to the selected period.
If you find yourself uncertain about what specific data refers to precisely, use your cursor to point at the **Information Icon** beside the data title to read a brief explanation about it.
 Another way to gain a deeper understanding of what each piece of data reflects is by checking our other help center articles.
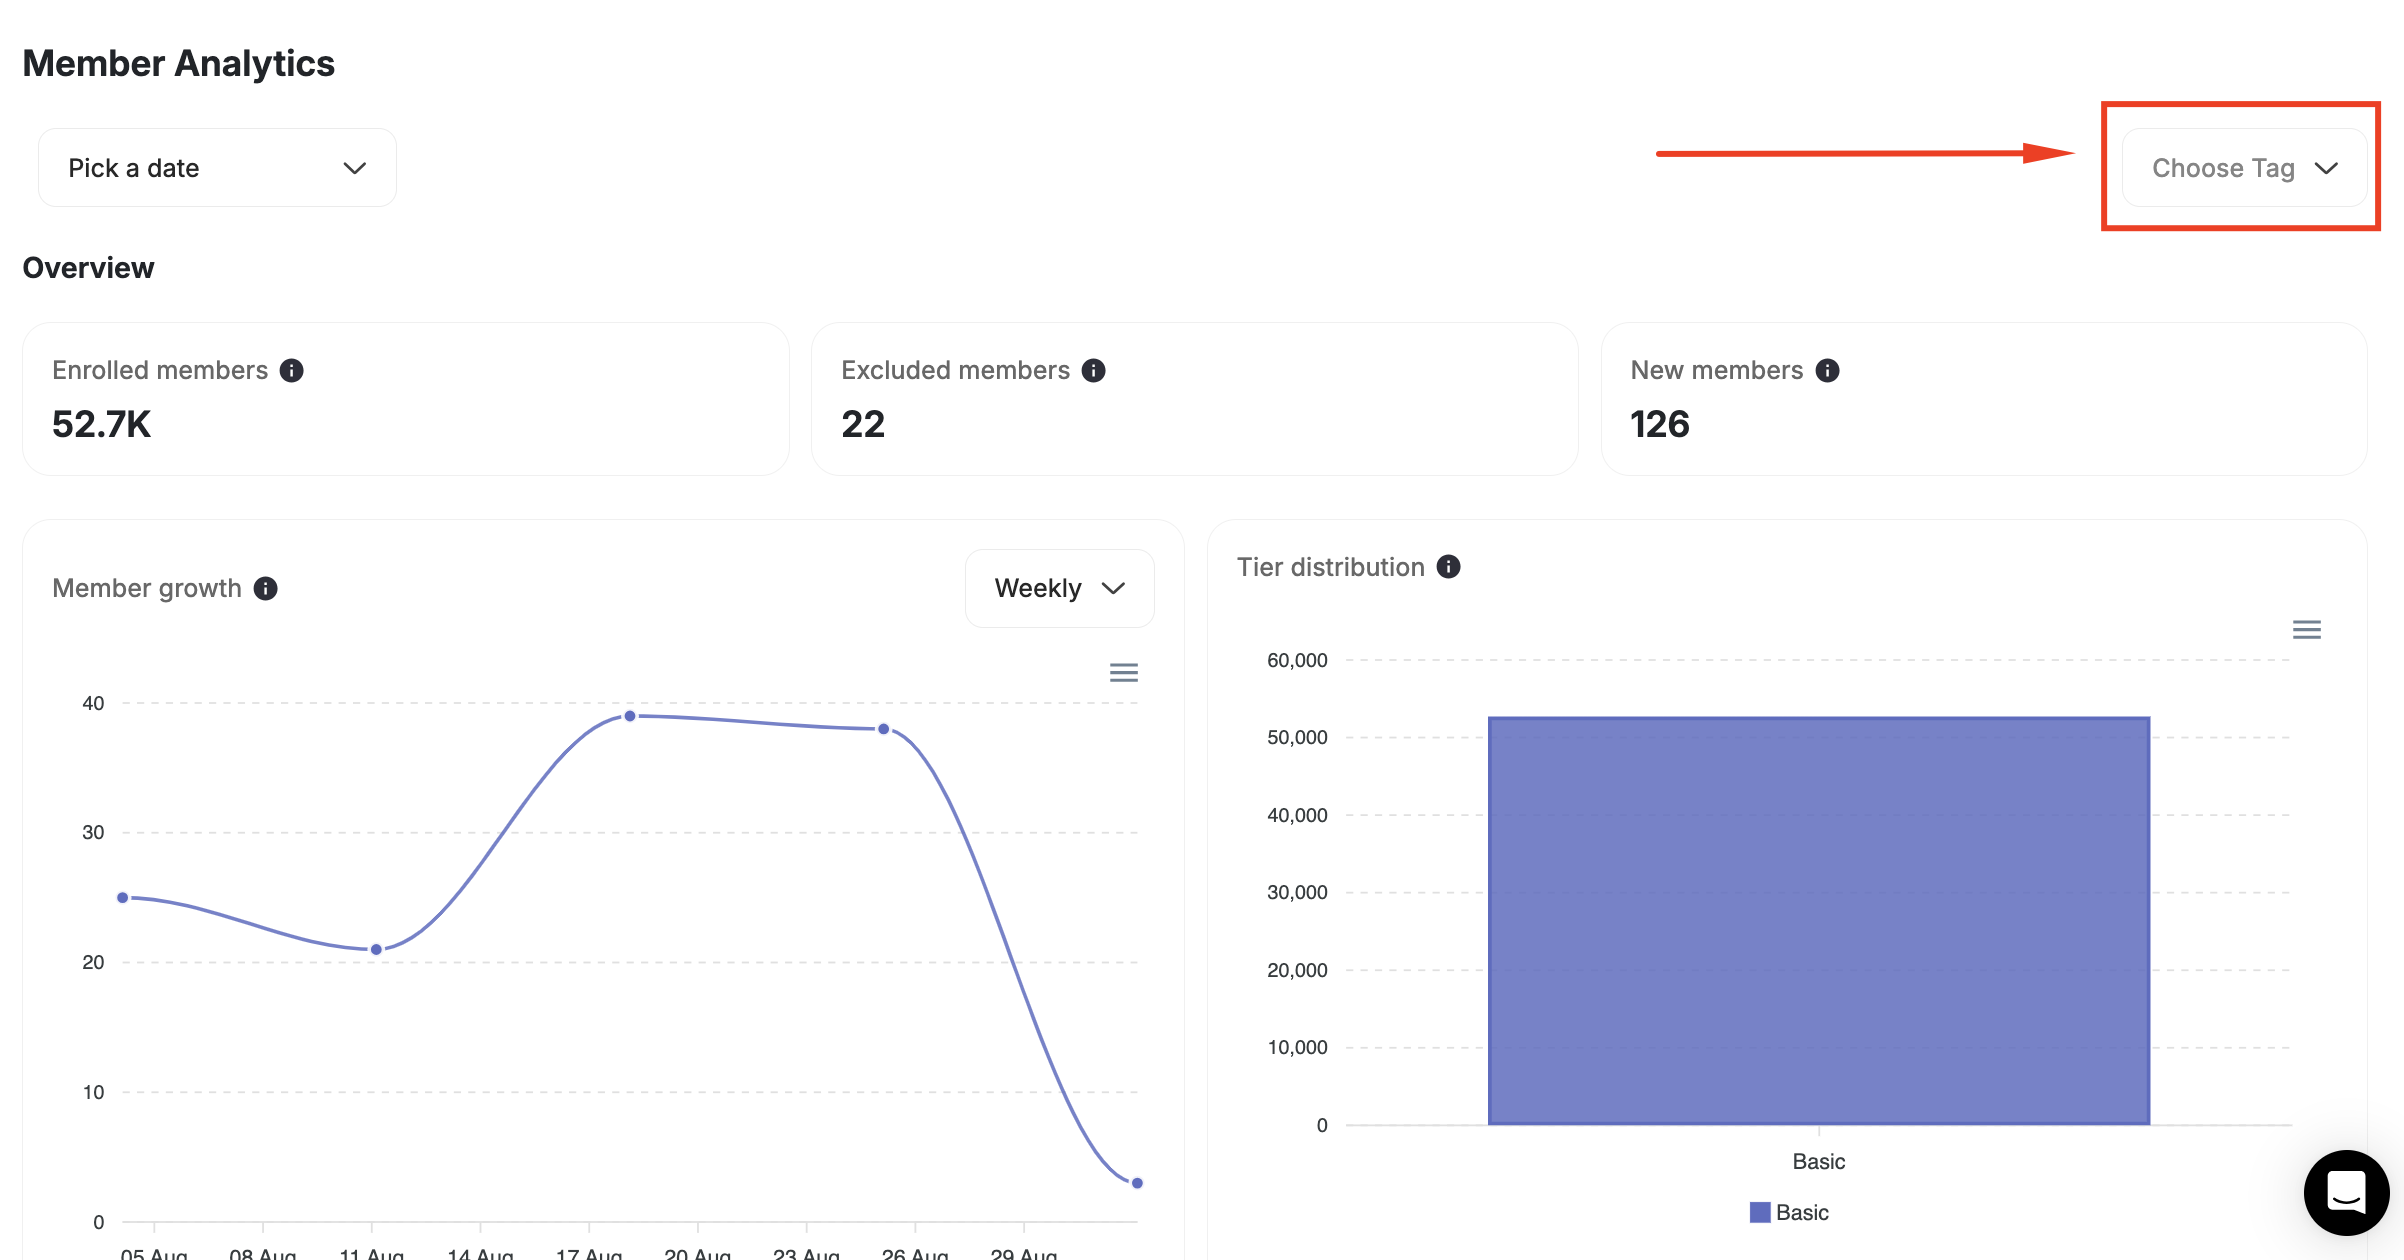
You can view more details about each group of customers that shares the same tag by clicking **Choose Tag**.
Another way to gain a deeper understanding of what each piece of data reflects is by checking our other help center articles.
You can view more details about each group of customers that shares the same tag by clicking **Choose Tag**.
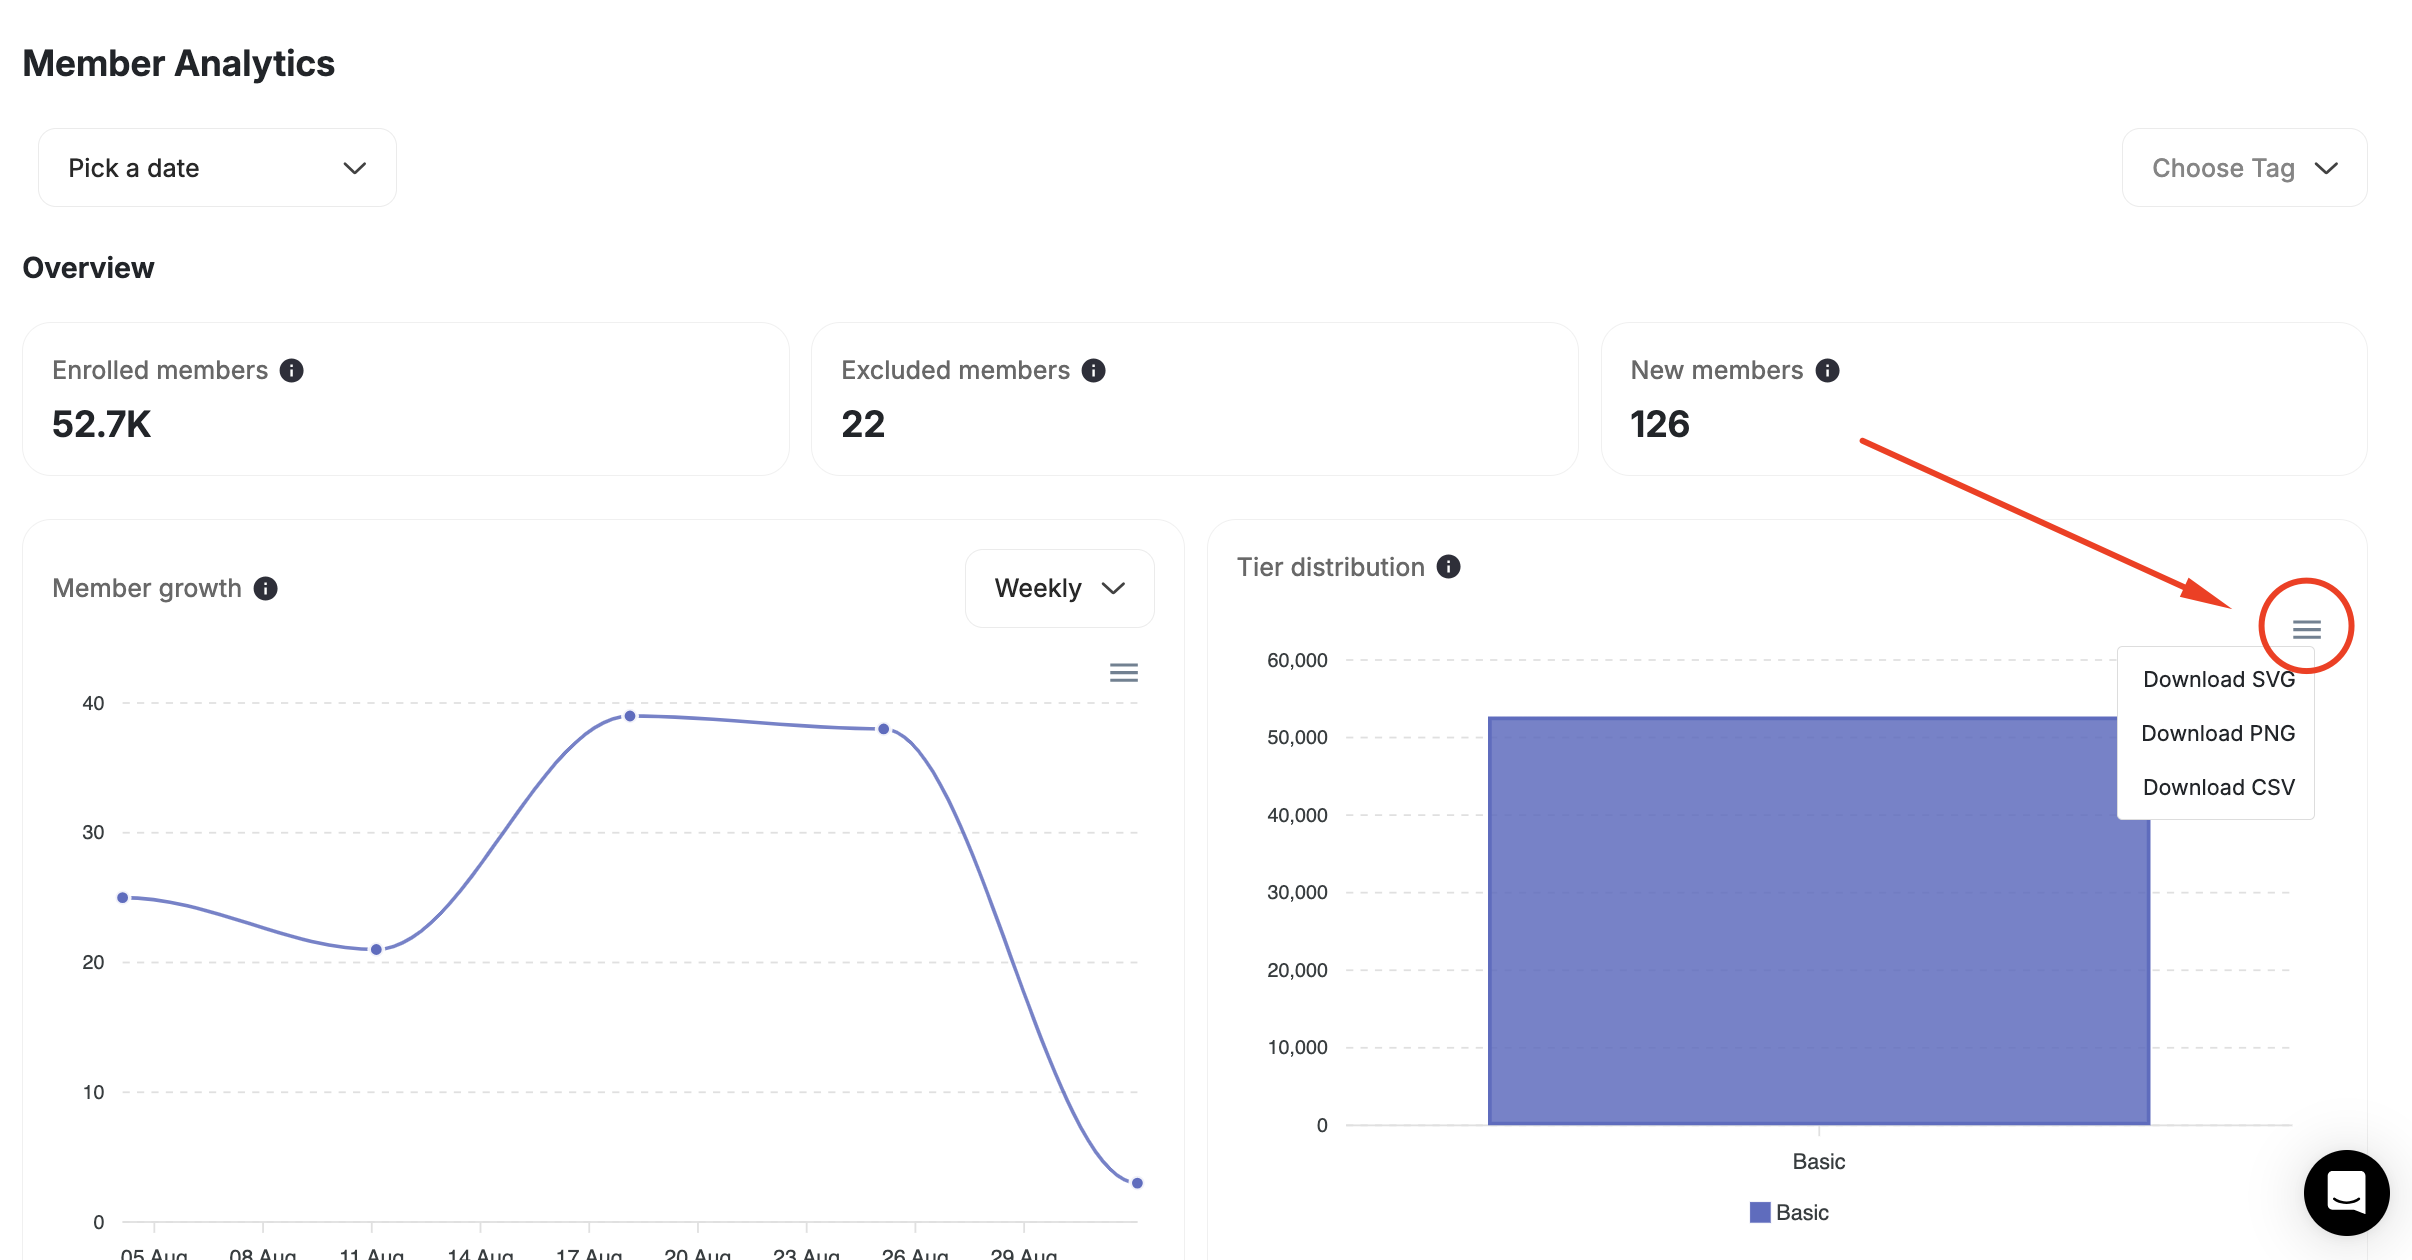
 You can export each report you view on its own to a **SVG, PNG, or CSV file** by clicking on the **Export Icon** on the top right of your data.
 ***
## What's Next?
Measure campaign reach, engagement, and rewards distribution.
Analyze customer spending, order values, and purchase frequency.
Evaluate referral activity, success rates, and revenue from referrals.
***
## What's Next?
Measure campaign reach, engagement, and rewards distribution.
Analyze customer spending, order values, and purchase frequency.
Evaluate referral activity, success rates, and revenue from referrals.