> ## Documentation Index
> Fetch the complete documentation index at: https://docs.gameball.co/llms.txt
> Use this file to discover all available pages before exploring further.
# What Are Member Analytics?
> Track enrolled member growth, engagement rates, and retention metrics to understand your loyalty program's performance.
Available on **All** plans.
Available on **All** plans.
Available on **All** plans.
Understanding your customer base is the foundation of making informed, data-driven decisions. The **Member Analytics** section in Gameball offers a comprehensive view of your enrolled customers, enabling you to track growth, engagement, and overall participation in your loyalty program.
***
## Overview Metrics
The **total number of customers currently enrolled** in your Gameball loyalty program.
**Calculation:**
1. **Included customers only**: Counts unique customers who are currently enrolled in the program.
2. **Not affected by time filters** -- always shows the real-time total.
3. **Affected by tag/segment filters**: Adjusts based on any applied filters (e.g., VIP Tier, Holiday2025).
4. **Excludes**: Deleted, opted-out, or excluded customers.
The **total number of customers currently excluded from the program is "profile marked as inactive"** in your Gameball account.
**Calculation:**
1. **Excluded customers only**: Counts all customers currently "excluded" from the program.
2. **Not affected by time filters** -- always shows the current count.
3. **Affected by tag/segment filters**: Adjusts based on any applied filters (e.g., VIP Tier, Holiday2025).
The **number of new customers who joined your program** during the selected time range.
**Calculation:**
1. **Join date first**: Based on the customer's "join date," if available. **Fallback**: If the join date is missing, use the customer's creation date in Gameball.
2. **Impacted by time filters**: Only counts members who joined within the selected date range.
3. **Affected by tag/segment filters**: Adjusts based on any applied filters.
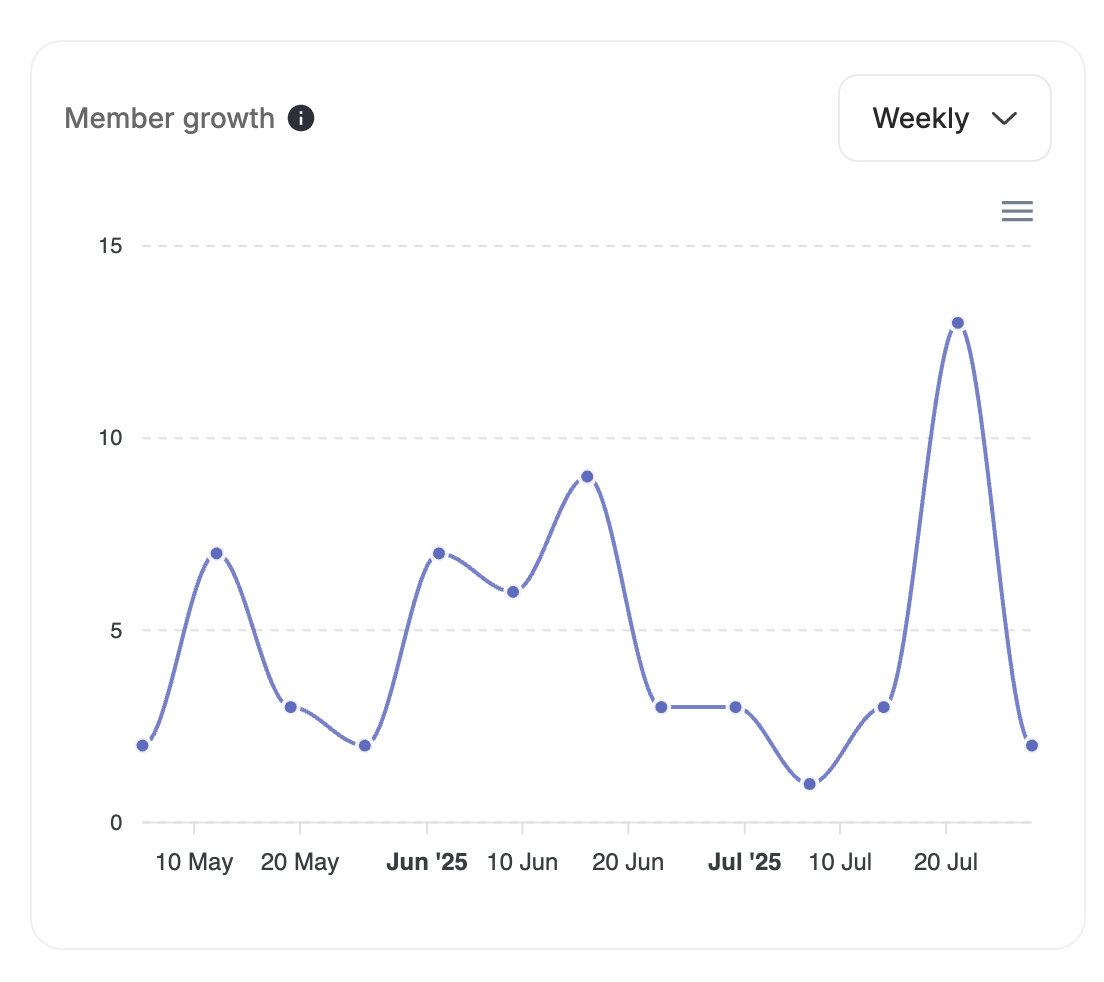
A **line chart** that visualizes **new customer acquisition over time**.
**Calculation:**
1. **New members**: Based on "join date"; if missing, falls back to creation date in Gameball.
2. **Impacted by time filters**: Reflects the selected date range.
3. **Affected by tag/segment filters**.
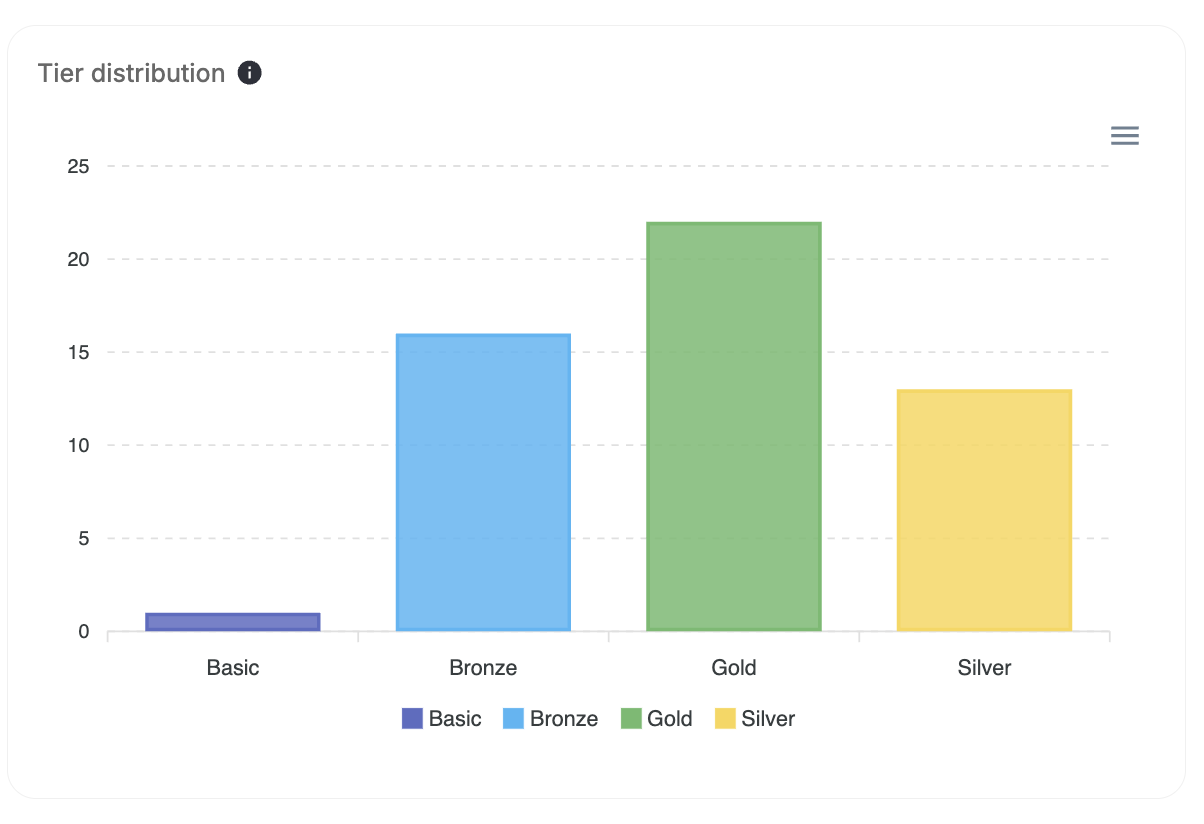
 The **breakdown of enrolled members across different loyalty tiers** in your program -- for example, Bronze, Silver, Gold, etc.
**Calculation:**
1. Count of members grouped by current tier (**based on most recent status**).
2. **Not affected by time filters** -- always shows the current count.
3. **Affected by tag/segment filters**: Will adjust if filters are applied.
The **breakdown of enrolled members across different loyalty tiers** in your program -- for example, Bronze, Silver, Gold, etc.
**Calculation:**
1. Count of members grouped by current tier (**based on most recent status**).
2. **Not affected by time filters** -- always shows the current count.
3. **Affected by tag/segment filters**: Will adjust if filters are applied.
 ***
## Engagement Metrics
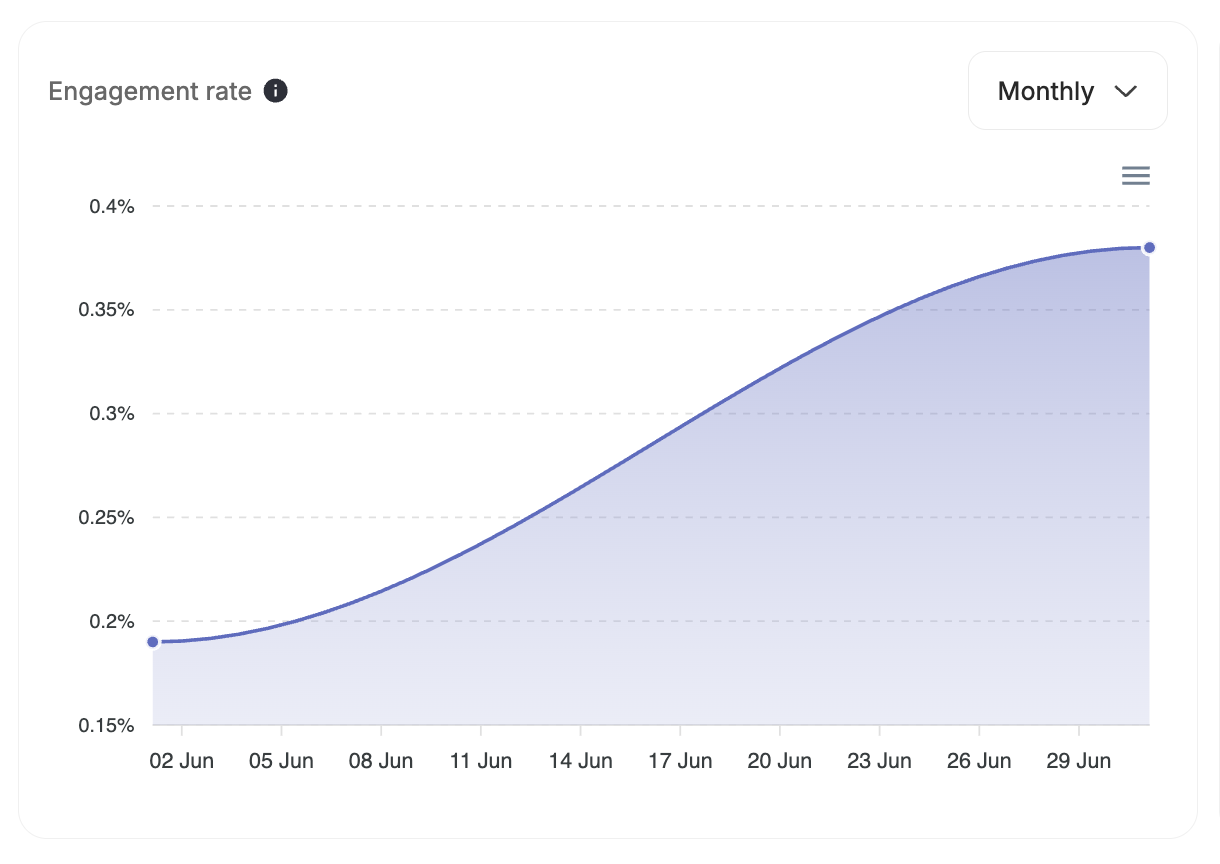
A **line chart** showing the **percentage of enrolled members actively engaging** with your loyalty program over time, based on the selected date range.
**Calculation:**
1. Engagement Rate = (Active Members / Total Enrolled Members) x 100
***
## Engagement Metrics
A **line chart** showing the **percentage of enrolled members actively engaging** with your loyalty program over time, based on the selected date range.
**Calculation:**
1. Engagement Rate = (Active Members / Total Enrolled Members) x 100
 2. **Active members:** Number of unique customers who did any of the following:
* Ordered
* Redeemed points
* Interacted with the widget
* Did an event
3. **Total Enrolled Members:** Counts unique customers who are currently enrolled in the program.
4. **Impacted by time filters** -- shows trends over the selected period.
5. **Affected by tag/segment filters**.
2. **Active members:** Number of unique customers who did any of the following:
* Ordered
* Redeemed points
* Interacted with the widget
* Did an event
3. **Total Enrolled Members:** Counts unique customers who are currently enrolled in the program.
4. **Impacted by time filters** -- shows trends over the selected period.
5. **Affected by tag/segment filters**.
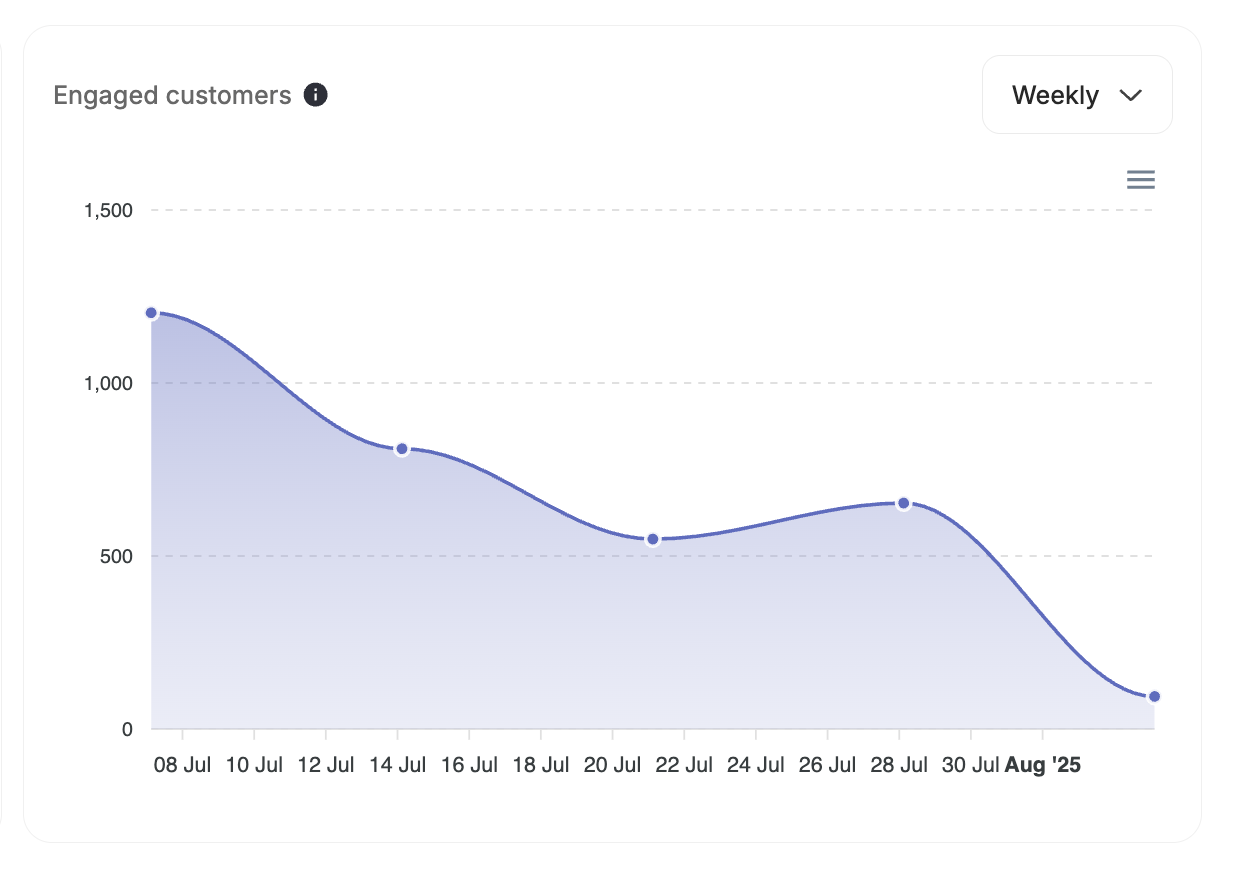
 A **line chart** showing the **number of unique customers who engaged** with your loyalty program during the selected timeframe.
**Calculation:**
1. Counts **unique customers** who performed **any of the following actions** during the selected date range:
* Order/transaction
* Redeemed points
* Interacted with the widget
* Did an event
2. **Impacted by time filters** -- shows trends over the selected period.
3. **Affected by tag/segment filters**.
A **line chart** showing the **number of unique customers who engaged** with your loyalty program during the selected timeframe.
**Calculation:**
1. Counts **unique customers** who performed **any of the following actions** during the selected date range:
* Order/transaction
* Redeemed points
* Interacted with the widget
* Did an event
2. **Impacted by time filters** -- shows trends over the selected period.
3. **Affected by tag/segment filters**.
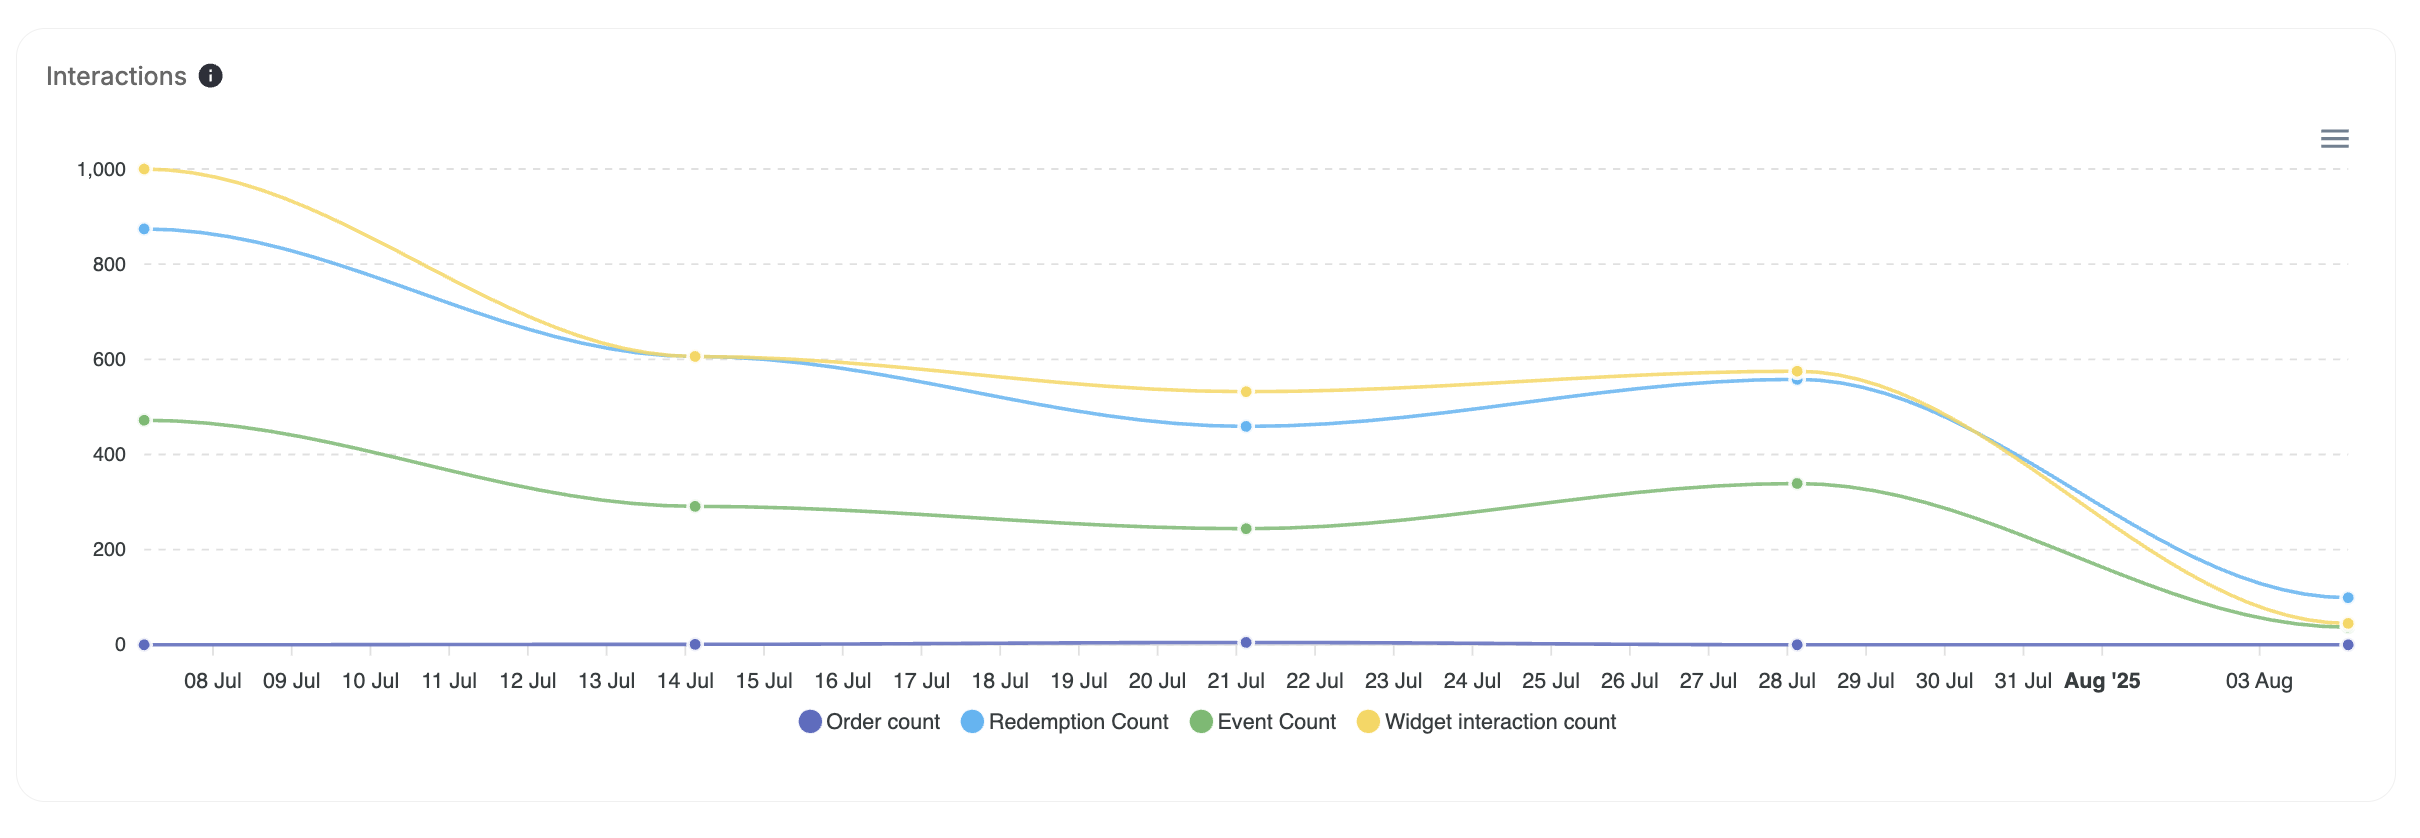
 A **line chart** showing the **number of total interactions** with your loyalty program during the selected timeframe, broken down by type.
**Calculation:**
1. Counts the total number of times customers performed **any** of the following actions during the selected date range:
1. Ordered
2. Redeemed points
3. Interacted with the widget
4. Did an event
2. **Impacted by time filters** -- shows trends over the selected period.
3. **Affected by tag/segment filters**.
A **line chart** showing the **number of total interactions** with your loyalty program during the selected timeframe, broken down by type.
**Calculation:**
1. Counts the total number of times customers performed **any** of the following actions during the selected date range:
1. Ordered
2. Redeemed points
3. Interacted with the widget
4. Did an event
2. **Impacted by time filters** -- shows trends over the selected period.
3. **Affected by tag/segment filters**.
 ***
## Retention Metrics
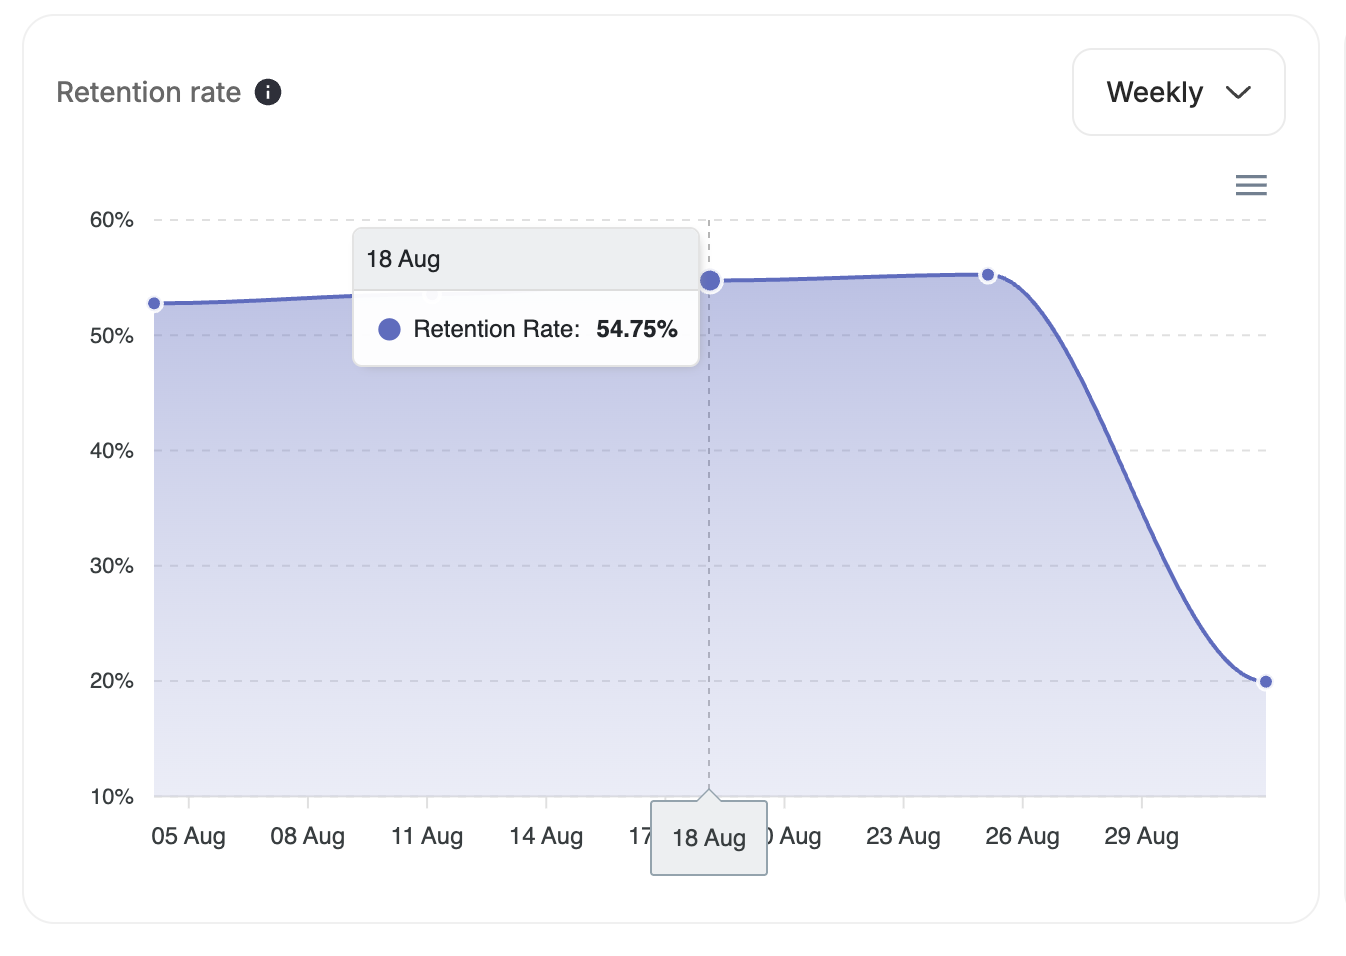
The percentage of **returning customers** -- those who placed an order in the current period **and** also placed an order in the **previous equivalent period**.
**Calculation:**
1. Retention Rate = (Returning Customers in Current Period / Total Customers in Previous Period) x 100
***
## Retention Metrics
The percentage of **returning customers** -- those who placed an order in the current period **and** also placed an order in the **previous equivalent period**.
**Calculation:**
1. Retention Rate = (Returning Customers in Current Period / Total Customers in Previous Period) x 100
 2. A **Returning Customer** is any customer who:
* Placed **at least one order** in the **current period** (week or month), **and**
* Also placed **at least one order** in the **previous equivalent period** (the week or month immediately before).
3. **Examples:**
* In a **monthly view**, a returning customer is someone who ordered this month **and** last month.
* In a **weekly view**, a returning customer is someone who ordered this week **and** last week.
4. **Impacted by time filters**:
1. If you select a **custom time range** (e.g., last 3 months) and break the graph **weekly**, the retention calculation is done **period-by-period**.
2. The graph shows retention for each week within the selected time range.
3. Each week's retention compares customers who ordered that week to those who ordered in the **previous week**.
5. **Affected by tag/segment filters**.
2. A **Returning Customer** is any customer who:
* Placed **at least one order** in the **current period** (week or month), **and**
* Also placed **at least one order** in the **previous equivalent period** (the week or month immediately before).
3. **Examples:**
* In a **monthly view**, a returning customer is someone who ordered this month **and** last month.
* In a **weekly view**, a returning customer is someone who ordered this week **and** last week.
4. **Impacted by time filters**:
1. If you select a **custom time range** (e.g., last 3 months) and break the graph **weekly**, the retention calculation is done **period-by-period**.
2. The graph shows retention for each week within the selected time range.
3. Each week's retention compares customers who ordered that week to those who ordered in the **previous week**.
5. **Affected by tag/segment filters**.
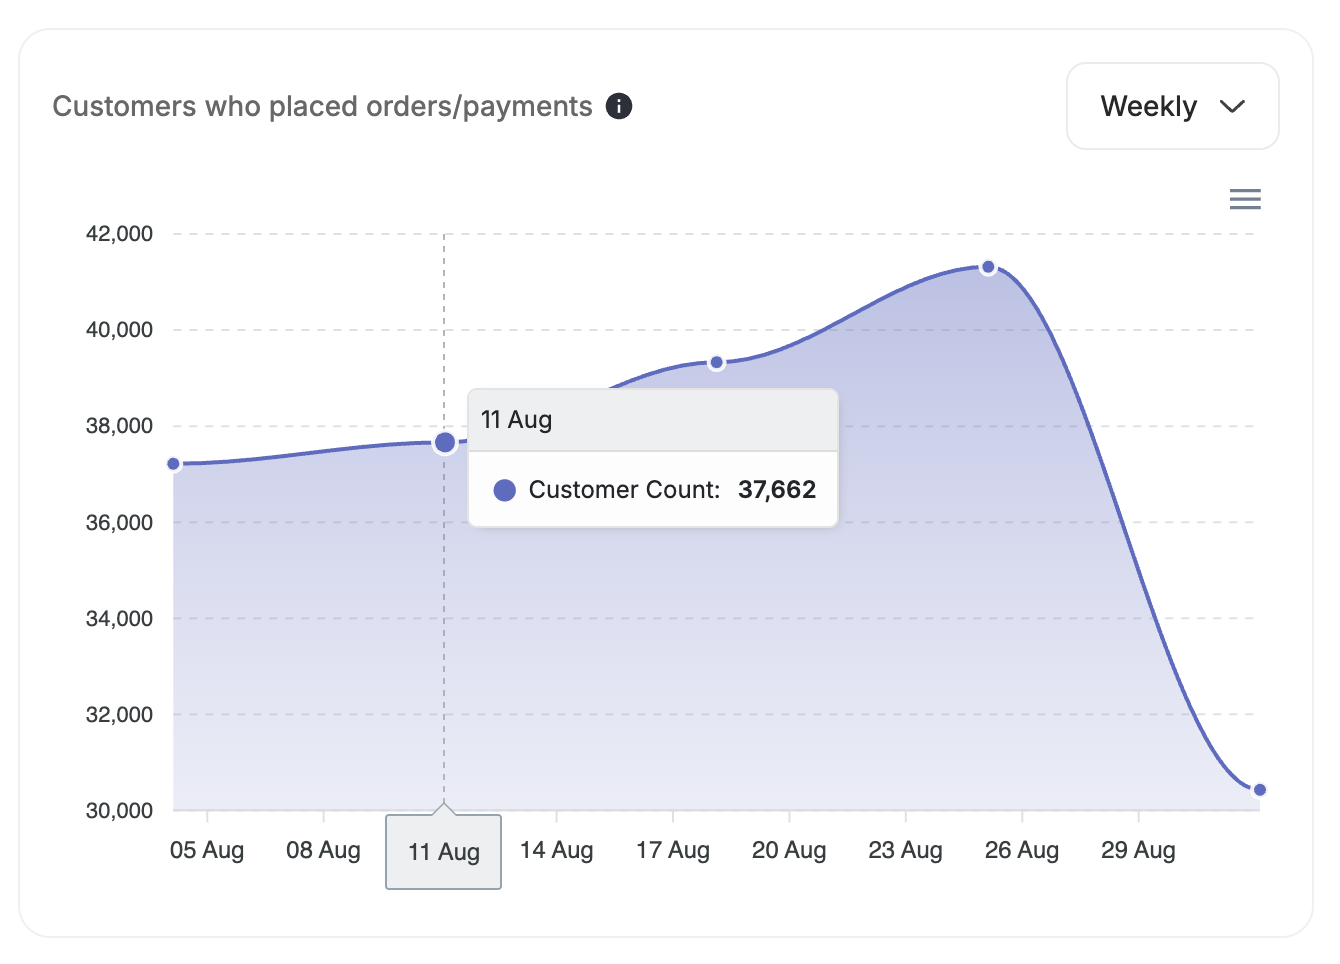
 Shows the **average number of unique customers per day** who placed at least one order, with results broken down **weekly or monthly**.
**Calculation:**
1. **Weekly Breakdown:**
1. For each day of the week (Sunday to Saturday), count the **unique customers** who placed at least one order that day.
2. Sum these daily counts for the week.
3. Divide the sum by **7** to get the weekly average of daily unique ordering customers.
2. **Monthly Breakdown:**
1. For each day of the month, count the **unique customers** who placed at least one order.
2. Sum these daily counts for the month.
3. Divide the sum by the **total number of days in the month** to get the monthly average of daily unique ordering customers.
3. **Impacted by time filters** -- shows trends over the selected period.
4. **Affected by tag/segment filters**.
Shows the **average number of unique customers per day** who placed at least one order, with results broken down **weekly or monthly**.
**Calculation:**
1. **Weekly Breakdown:**
1. For each day of the week (Sunday to Saturday), count the **unique customers** who placed at least one order that day.
2. Sum these daily counts for the week.
3. Divide the sum by **7** to get the weekly average of daily unique ordering customers.
2. **Monthly Breakdown:**
1. For each day of the month, count the **unique customers** who placed at least one order.
2. Sum these daily counts for the month.
3. Divide the sum by the **total number of days in the month** to get the monthly average of daily unique ordering customers.
3. **Impacted by time filters** -- shows trends over the selected period.
4. **Affected by tag/segment filters**.
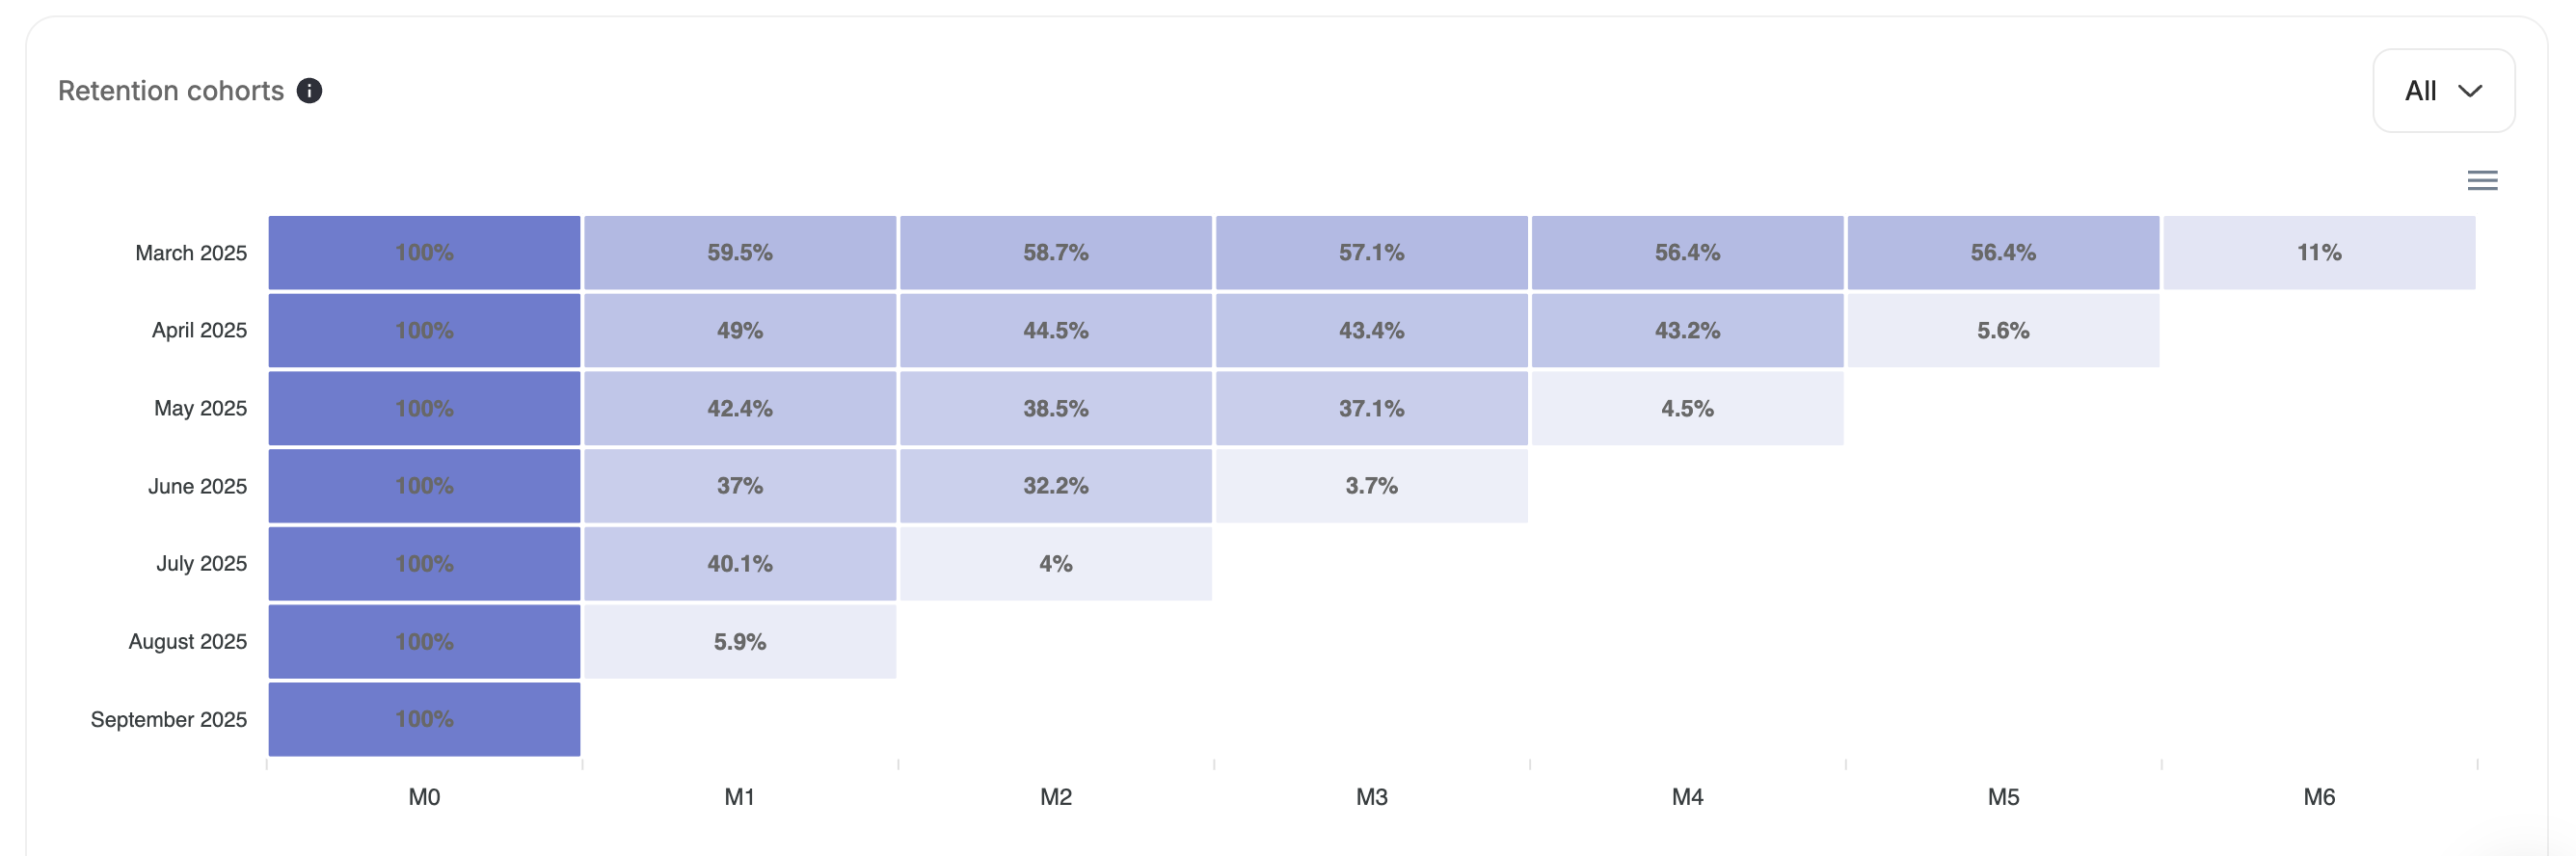
 Categorizes customers into **Non-Redeemers**, **One-Time Redeemers**, and **Frequent Redeemers** to help you understand long-term customer behavior and loyalty trends.
**Calculation:**
1. **Identify cohort members:**
* Select **all unique customers** who placed at least one order in the **last 6 months**.
2. **Assign cohorts:**
* Group each customer into a **monthly cohort** based on the **month of their first purchase**.
3. **Track retention per cohort:** For each subsequent month, calculate:
Categorizes customers into **Non-Redeemers**, **One-Time Redeemers**, and **Frequent Redeemers** to help you understand long-term customer behavior and loyalty trends.
**Calculation:**
1. **Identify cohort members:**
* Select **all unique customers** who placed at least one order in the **last 6 months**.
2. **Assign cohorts:**
* Group each customer into a **monthly cohort** based on the **month of their first purchase**.
3. **Track retention per cohort:** For each subsequent month, calculate:
 4. **Not affected by time filters** -- always shows the real-time total.
5. **Affected by tag/segment filters**.
4. **Not affected by time filters** -- always shows the real-time total.
5. **Affected by tag/segment filters**.