> ## Documentation Index
> Fetch the complete documentation index at: https://docs.gameball.co/llms.txt
> Use this file to discover all available pages before exploring further.
# How Do I Track My Purchase Behaviour Using Gameball Analytics?
> Understand how your customers are behaving on your platform when it comes to placing orders and taking consecutive actions.
Having explained how to generally understand, use, and navigate through the analytics section on Gameball to learn about the performance of Gameball as a program and its influence on your business. [Learn more](/product-documentation/analytics/introduction-to-gameball-analytics)
The **Purchase Behaviour** page in the analytics section focuses on how much your customers spend on your store and provides further details on your customers' placed orders information.
***
## Where to Find the Purchase Behaviour Analytics Page
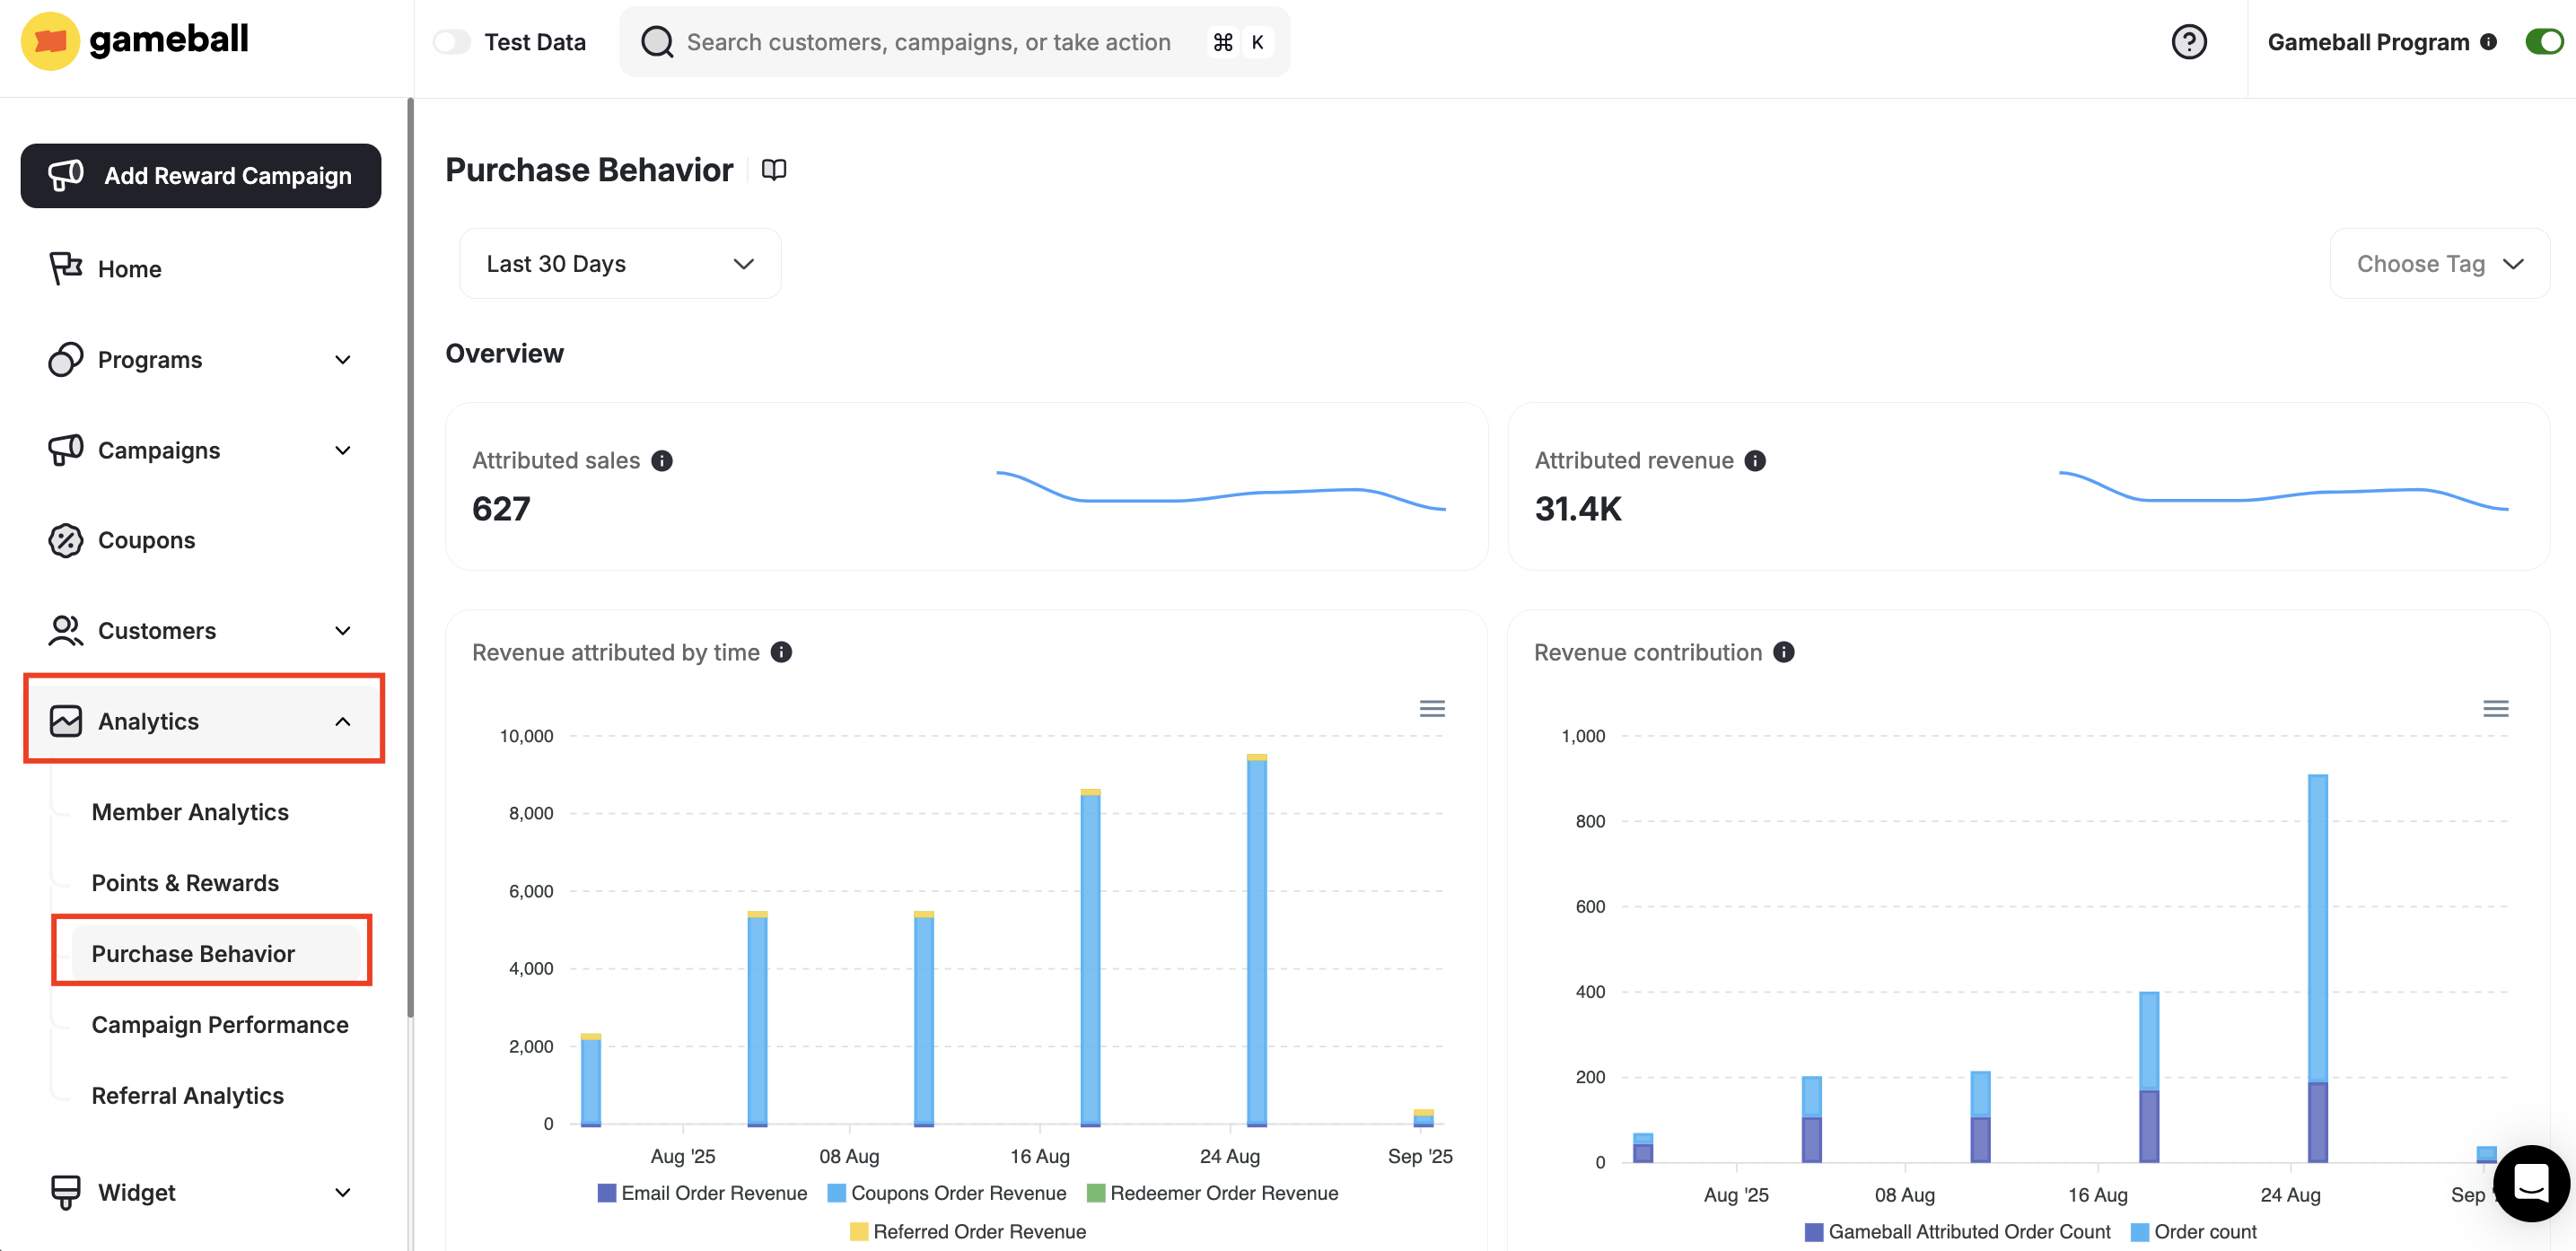
Go to Gameball **Dashboard**, and click **Analytics** from the left bar.
Click **Purchase Behavior** from the analytics navigation.
 ***
## What Is the Purchase Behaviour Analytics Page About?
Purchase Behaviour analytics gives you insights into customer purchase habits and how Gameball directly influences their spending. You'll find detailed data about order values, purchase frequency, lifetime value, and attributed revenue.
***
## Purchase Behaviour Metrics
Total number of purchases directly influenced by Gameball.
***
## What Is the Purchase Behaviour Analytics Page About?
Purchase Behaviour analytics gives you insights into customer purchase habits and how Gameball directly influences their spending. You'll find detailed data about order values, purchase frequency, lifetime value, and attributed revenue.
***
## Purchase Behaviour Metrics
Total number of purchases directly influenced by Gameball.
 Shows the total number of purchases that were directly influenced by Gameball campaigns and activities. This helps you measure how much of your sales are driven by Gameball rather than organic or external sources.
Total revenue generated from purchases directly influenced by Gameball.
Shows the total number of purchases that were directly influenced by Gameball campaigns and activities. This helps you measure how much of your sales are driven by Gameball rather than organic or external sources.
Total revenue generated from purchases directly influenced by Gameball.
 Reflects the total amount of revenue generated from purchases where Gameball had a direct impact. It quantifies Gameball's contribution to your business growth in terms of monetary value.
Tracks the revenue directly influenced by Gameball over time.
Reflects the total amount of revenue generated from purchases where Gameball had a direct impact. It quantifies Gameball's contribution to your business growth in terms of monetary value.
Tracks the revenue directly influenced by Gameball over time.
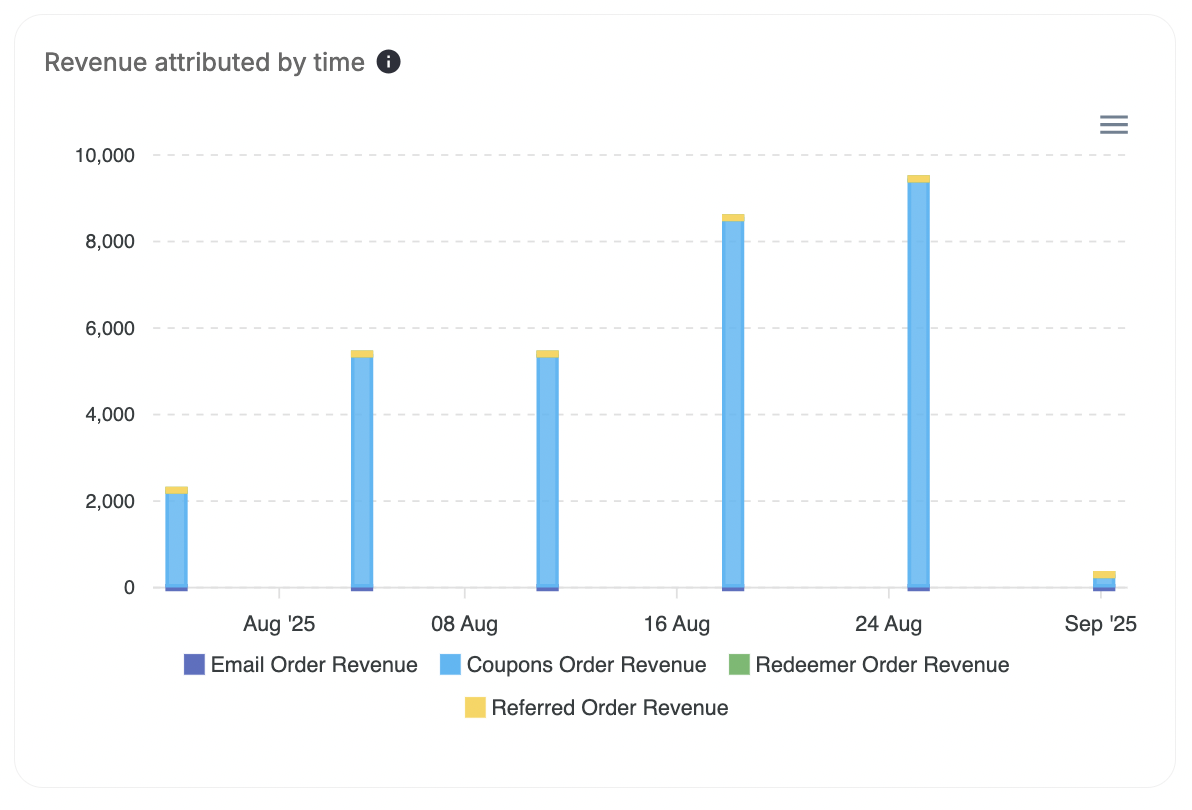 Displays how attributed revenue changes over time. Tracking this trend allows you to understand whether Gameball's influence is increasing, decreasing, or staying consistent during specific periods.
A comparison of your store's overall sales versus the portion of revenue directly influenced by Gameball.
Displays how attributed revenue changes over time. Tracking this trend allows you to understand whether Gameball's influence is increasing, decreasing, or staying consistent during specific periods.
A comparison of your store's overall sales versus the portion of revenue directly influenced by Gameball.
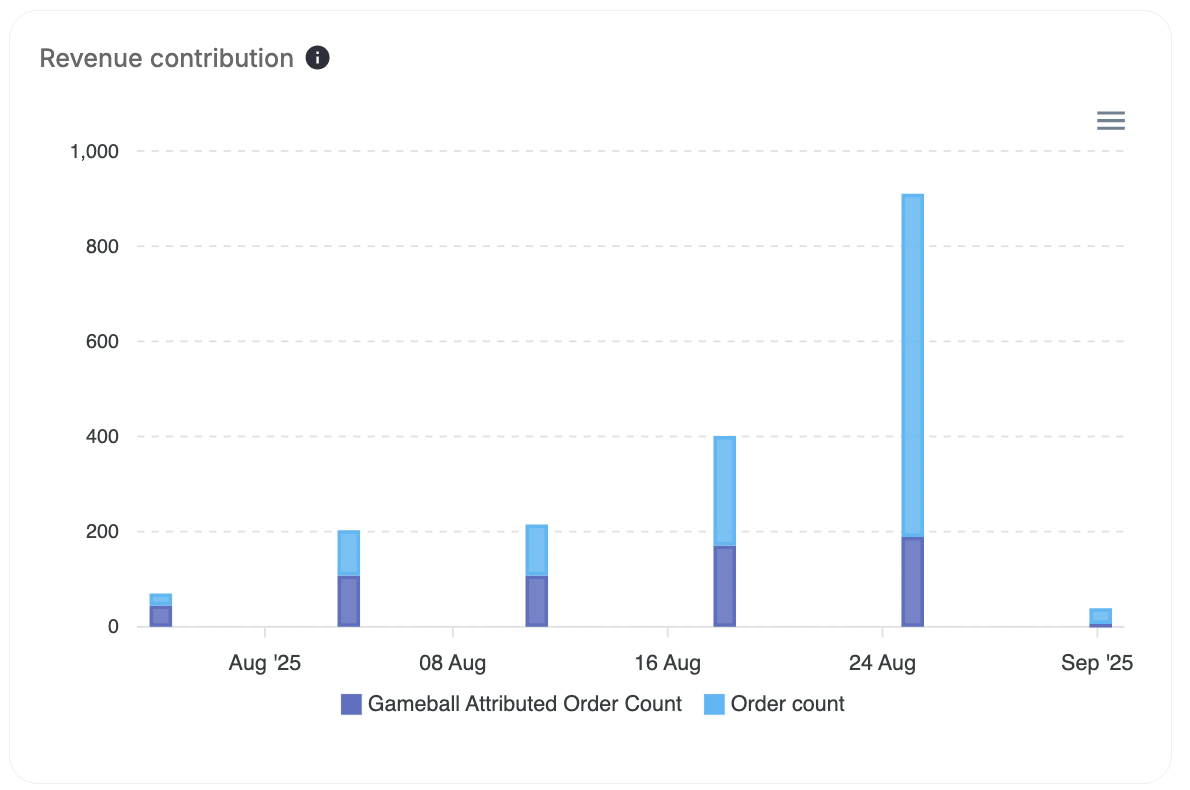 Compares your overall store revenue with the portion of revenue directly influenced by Gameball. This view makes it easy to see how much of your total income comes from Gameball-driven actions.
The average amount spent per order by customers.
Compares your overall store revenue with the portion of revenue directly influenced by Gameball. This view makes it easy to see how much of your total income comes from Gameball-driven actions.
The average amount spent per order by customers.
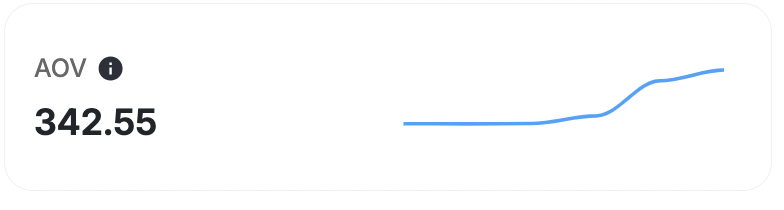 Calculates the average amount customers spend per order. Monitoring AOV helps you evaluate whether Gameball is encouraging higher-value purchases and whether customers are spending more in each transaction.
The number of purchases made per member over a given period.
Calculates the average amount customers spend per order. Monitoring AOV helps you evaluate whether Gameball is encouraging higher-value purchases and whether customers are spending more in each transaction.
The number of purchases made per member over a given period.
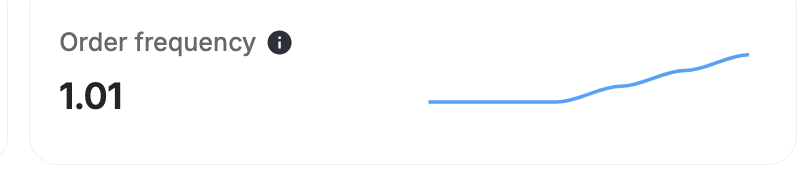 Shows how many times a customer typically purchases within a certain period. High order frequency often signals strong customer loyalty and engagement, while lower frequency may highlight opportunities to re-engage.
The average number of items in each purchase.
Shows how many times a customer typically purchases within a certain period. High order frequency often signals strong customer loyalty and engagement, while lower frequency may highlight opportunities to re-engage.
The average number of items in each purchase.
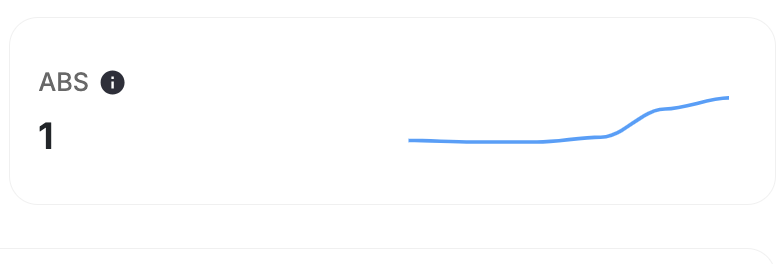 Measures the average number of items customers include in each purchase. A larger basket size can indicate effective bundling strategies, cross-sell efforts, or the success of Gameball incentives in encouraging customers to add more items.
Compares customer lifetime value across different groups, such as one-time buyers, frequent buyers, and non-redeemers.
Measures the average number of items customers include in each purchase. A larger basket size can indicate effective bundling strategies, cross-sell efforts, or the success of Gameball incentives in encouraging customers to add more items.
Compares customer lifetime value across different groups, such as one-time buyers, frequent buyers, and non-redeemers.
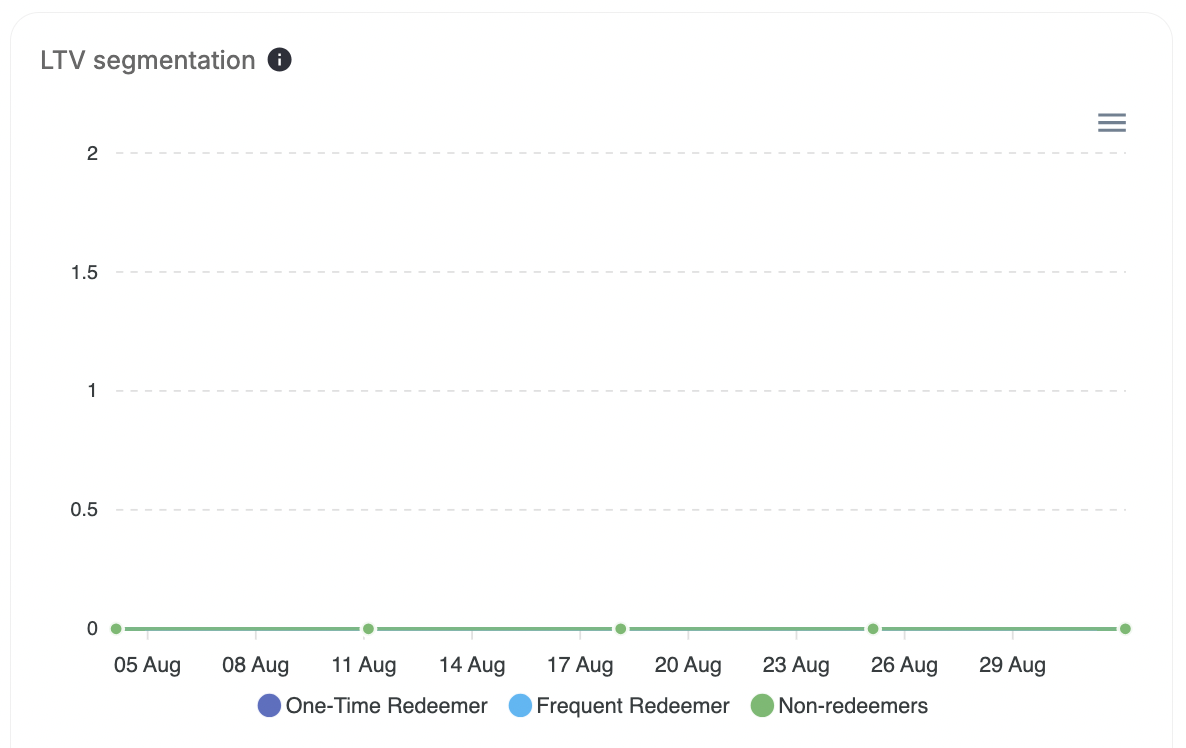 Compares customer lifetime value across different groups such as one-time buyers, frequent buyers, and non-redeemers. This breakdown helps you identify which groups contribute most to your long-term revenue and where you may need to focus retention strategies.
Shows how the average order value varies across different customer segments.
Compares customer lifetime value across different groups such as one-time buyers, frequent buyers, and non-redeemers. This breakdown helps you identify which groups contribute most to your long-term revenue and where you may need to focus retention strategies.
Shows how the average order value varies across different customer segments.
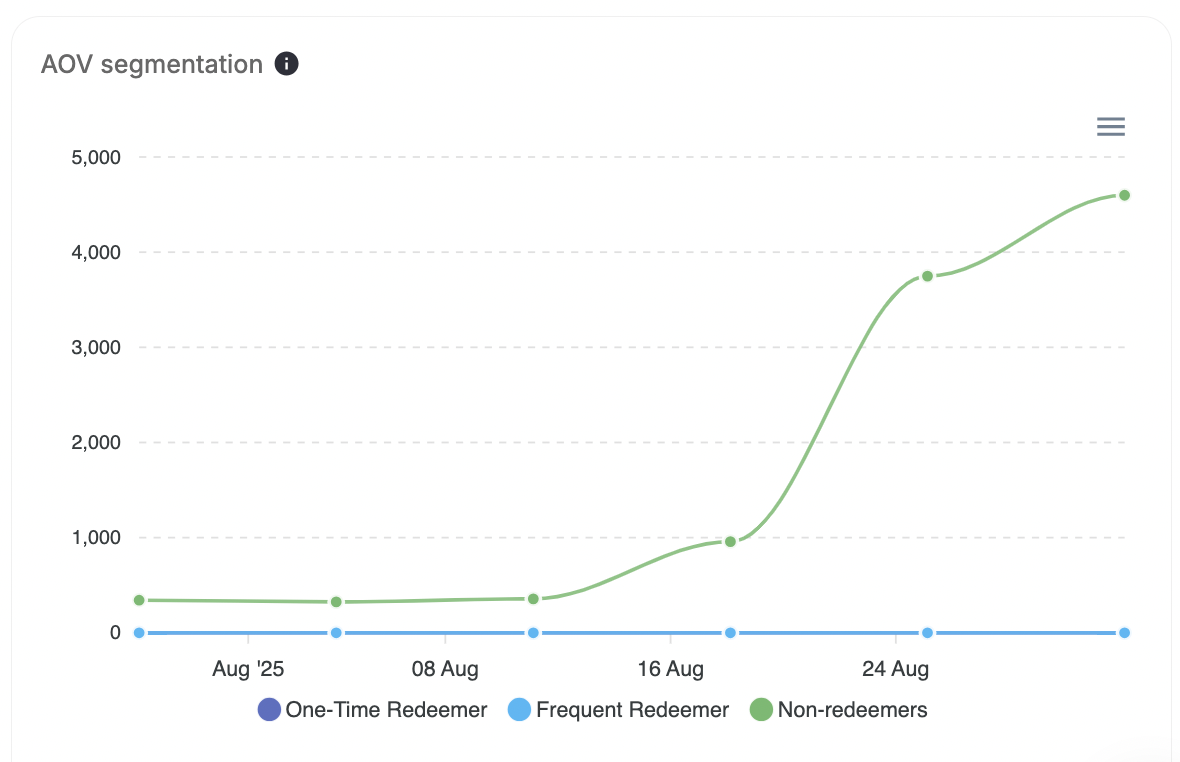 Highlights differences in spending behavior across customer groups. For example, frequent buyers may have a higher or lower average order value compared to one-time buyers, helping you tailor promotions for each group.
Breakdown of purchase frequency by different customer segments.
Highlights differences in spending behavior across customer groups. For example, frequent buyers may have a higher or lower average order value compared to one-time buyers, helping you tailor promotions for each group.
Breakdown of purchase frequency by different customer segments.
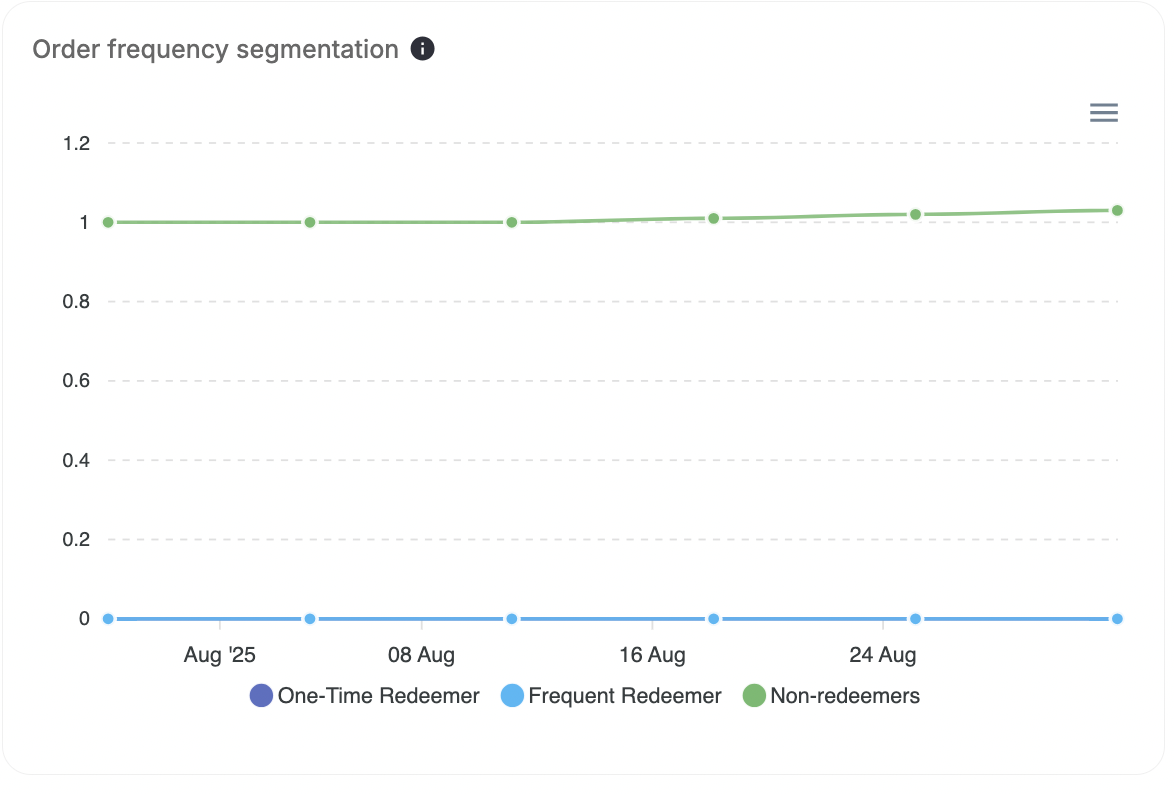 Breaks down purchase frequency across different customer segments. This shows whether certain groups are buying regularly, occasionally, or rarely, and supports strategies for encouraging repeat purchases.
Compares average basket size across one-time buyers, frequent buyers, and non-redeemers.
Breaks down purchase frequency across different customer segments. This shows whether certain groups are buying regularly, occasionally, or rarely, and supports strategies for encouraging repeat purchases.
Compares average basket size across one-time buyers, frequent buyers, and non-redeemers.
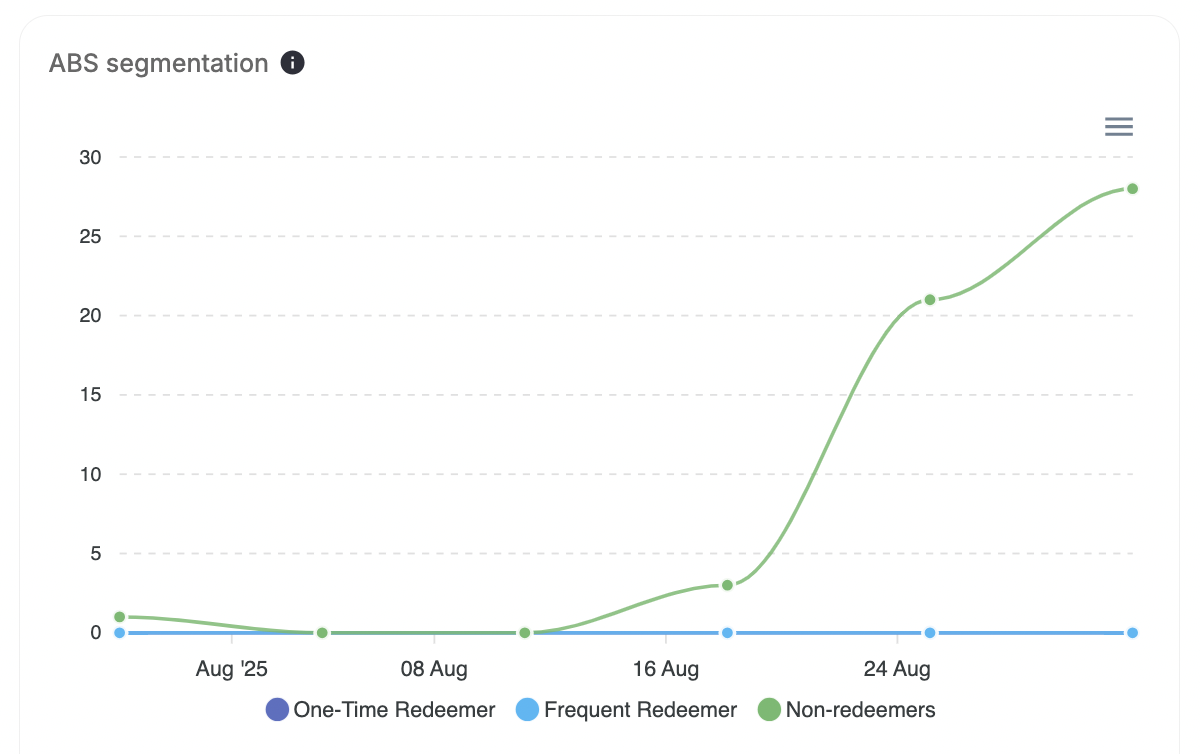 Compares average basket size across different customer groups (one-time, frequent, non-redeemers). Understanding these differences can help optimize upsell or cross-sell strategies for each segment.
Total number of orders or payments recorded over time.
Compares average basket size across different customer groups (one-time, frequent, non-redeemers). Understanding these differences can help optimize upsell or cross-sell strategies for each segment.
Total number of orders or payments recorded over time.
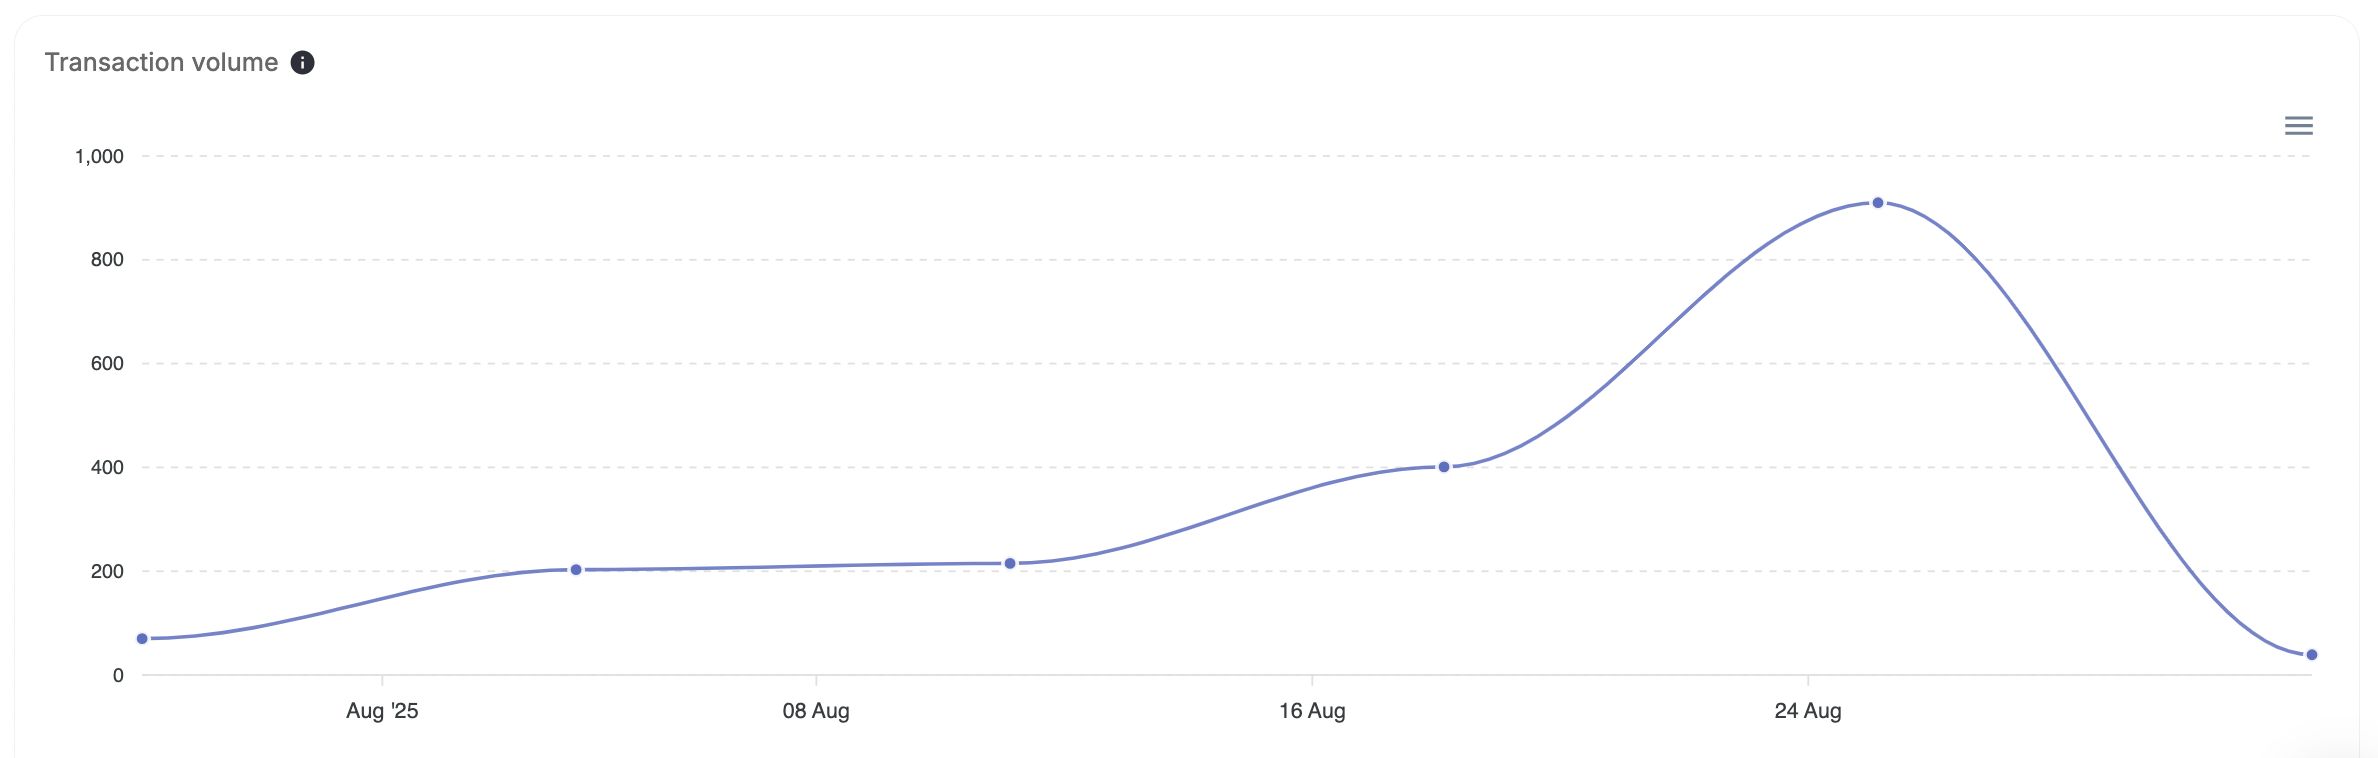 Displays the total number of orders or payments recorded over time, regardless of their value. This helps you spot overall purchasing activity trends and assess whether engagement campaigns are driving more transactions.
***
## What's Next?
Learn how to navigate and use the analytics section.
Measure campaign reach, engagement, and rewards distribution.
Displays the total number of orders or payments recorded over time, regardless of their value. This helps you spot overall purchasing activity trends and assess whether engagement campaigns are driving more transactions.
***
## What's Next?
Learn how to navigate and use the analytics section.
Measure campaign reach, engagement, and rewards distribution.